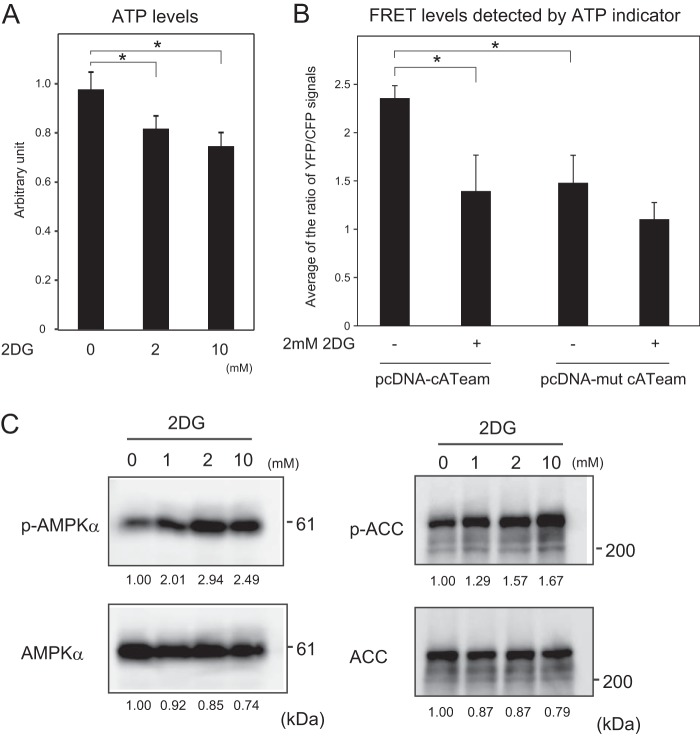
FIG 3.
AMPK is activated by 2DG. (A) MCF-7 cells were cultured for 2 h in RPMI 1640 supplemented with 10% serum in the presence of 2DG at the indicated concentrations, and the cellular ATP levels were detected by the luciferase assay system. The results were expressed as values relative to that without 2DG. The mean values with standard deviations (n = 12) are indicated. *, P < 0.05. (B) MCF-7 cells were cultured for 2 h in RPMI 1640 supplemented with 10% serum in the presence or absence of 2 mM 2DG, and the cellular ATP levels were detected by a FRET-based ATP indicator system with pcDNA-cATeam (see Fig. S1 in the supplemental material). The results were expressed as the ratio of YFP/CFP signals. The values in cells transfected with mutant type ATeam (pcDNA-mut cATeam) were used to detect background signals. Mean values with the standard deviations (n = 10) are indicated. *, P < 0.05. (C) Phosphorylation of AMPK and ACC by treatment with 2DG. MCF-7 cells were cultured 2 h in RPMI 1640 supplemented with 10% serum in the presence of 2DG at the indicated concentrations. Cells were lysed and analyzed by Western blotting to detect phosphorylated AMPK (phosphorylated Thr-172), total AMPK, phosphorylated ACC (phosphorylated Ser-79), and total ACC. The positions of protein markers with defined molecular masses are indicated on the right side of the figure. The relative intensities of bands are shown under the panels.

