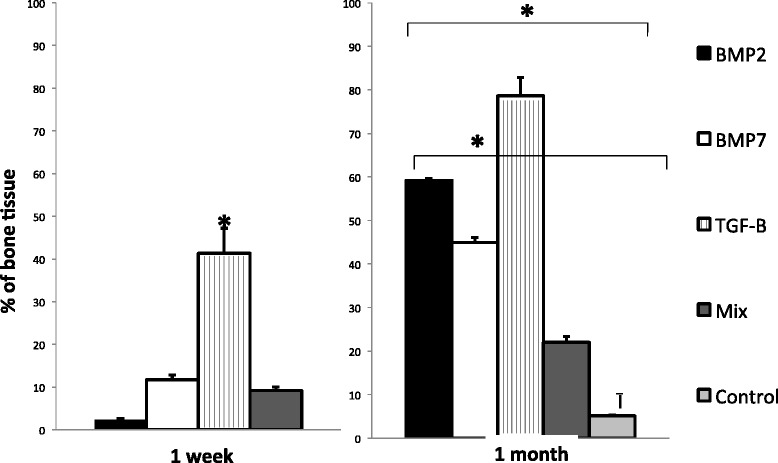
Figure 3.

Determination of the percentage of bone tissue by automated morphometry after one and four weeks of implantation adding the indicated growth factors. Results are presented as means and standard deviation of three different dogs in the indicated time points. Mix means implants with the three factors in the same concentration. Asterisk represent statistical difference (p < 0.005) among the indicated groups. Two independent experiments were run with similar results.
