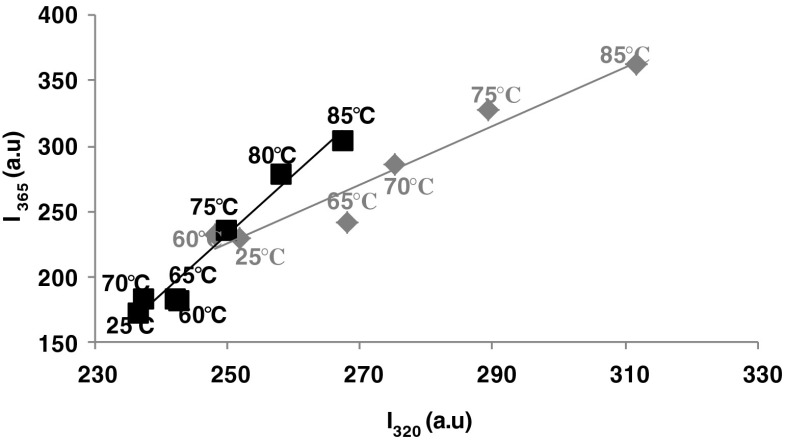
Fig. 1.
Phase diagram analysis of heat-induced conformational changes of β-Lg (grey diamonds) and β-Lg-LA complex (black squares) based on intrinsic fluorescence intensity values measured at wavelengths 320 and 365 nm. The temperature values are indicated in the vicinity of the corresponding symbol. Three independent tests were carried out in each case and SD was lower than 2.5 %

