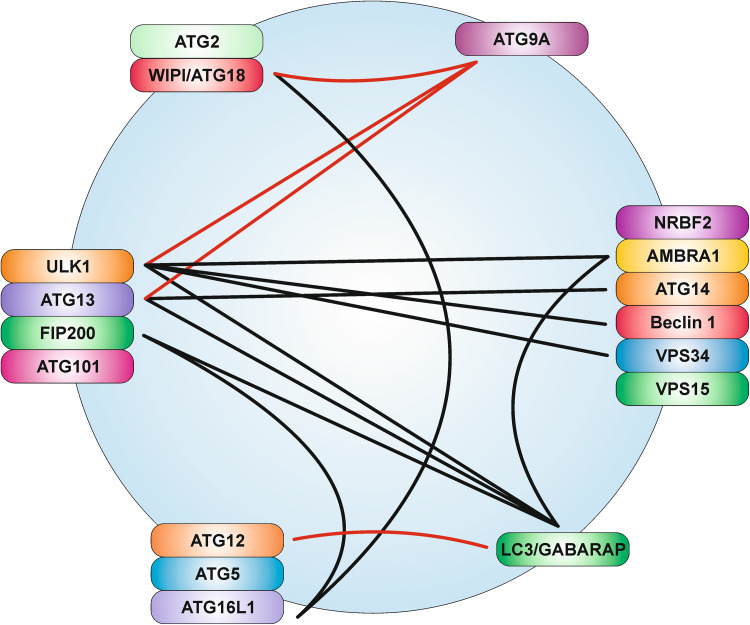
Fig. 4.
The ATG “spiderweb”. This scheme depicts the crosstalk between the six ATG signaling modules described in this review. The adjacent positioning of proteins within the single modules does not necessarily reflect direct interactions of the components. Lines can indicate both interaction and/or phosphorylation (by ULK1). Crosstalks identified for yeast orthologs are indicated by red lines

