Fig. 6.

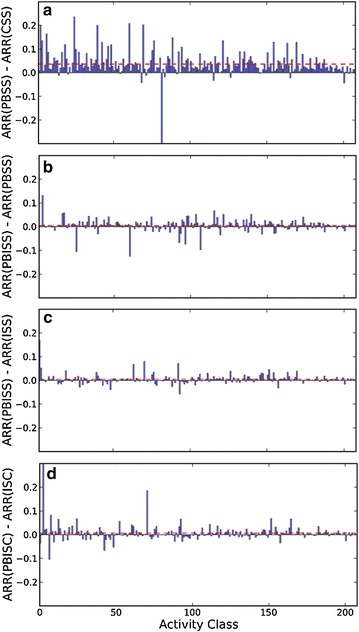
Distribution of ∆ARRs of 208 activity classes between a PBSS and CSS, between b PBISS and PBSS, between c PBISS and ISS, and between d PBISC and ISC. The dashed line in red color shows the average value of 208 ∆APRs

Distribution of ∆ARRs of 208 activity classes between a PBSS and CSS, between b PBISS and PBSS, between c PBISS and ISS, and between d PBISC and ISC. The dashed line in red color shows the average value of 208 ∆APRs