Fig. 2.

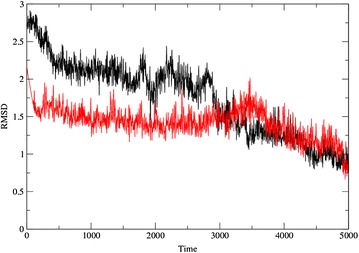
The RMSD plot of barbituric acid derivatives enol and keto complexes. Red color represents the enol form and black color represents the keto form RMSD

The RMSD plot of barbituric acid derivatives enol and keto complexes. Red color represents the enol form and black color represents the keto form RMSD