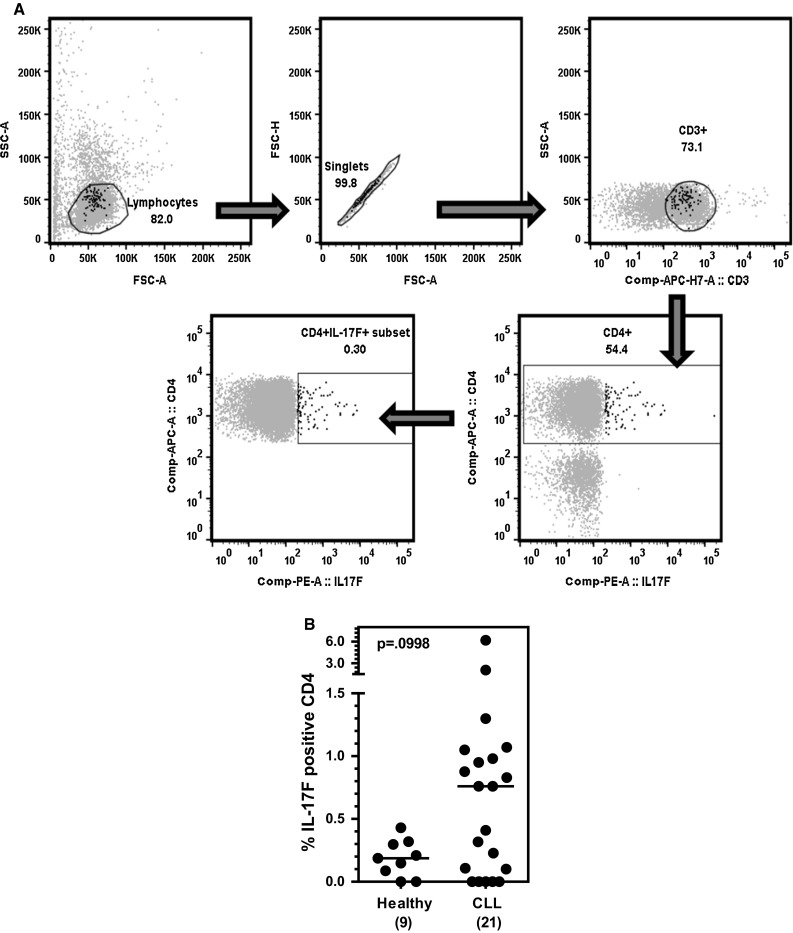
Fig. 1.

Percentage of IL-17F-expressing Th17 cells in the blood of CLL patients versus healthy controls. a Flow cytometry strategy to quantify IL-17F-expressing CD4 + T cells (“Th17F”). PBMCs from a single age-matched healthy control subject were stained for surface markers and intracellular IL-17F and analyzed by flow cytometry. Plots illustrate gating of the terminally selected “Th17F” (CD3+CD4+IL-17F+) population (lower left plot). Back-gating shows that the “Th17F” population (black highlighted cells in all plots) selected for analysis is comprised of singlet lymphocytes (upper left and middle plots) that are CD3+ (upper right plot) and CD4+ (lower right plot). b Frozen aliquots of PBMCs from CLL patients (n = 21) and healthy age-matched individuals (n = 9) were thawed and stained for surface markers and intracellular IL-17F (or IL-17A) and analyzed by flow cytometry. Statistical significance was examined by the Mann–Whitney test
