
Figure 2.
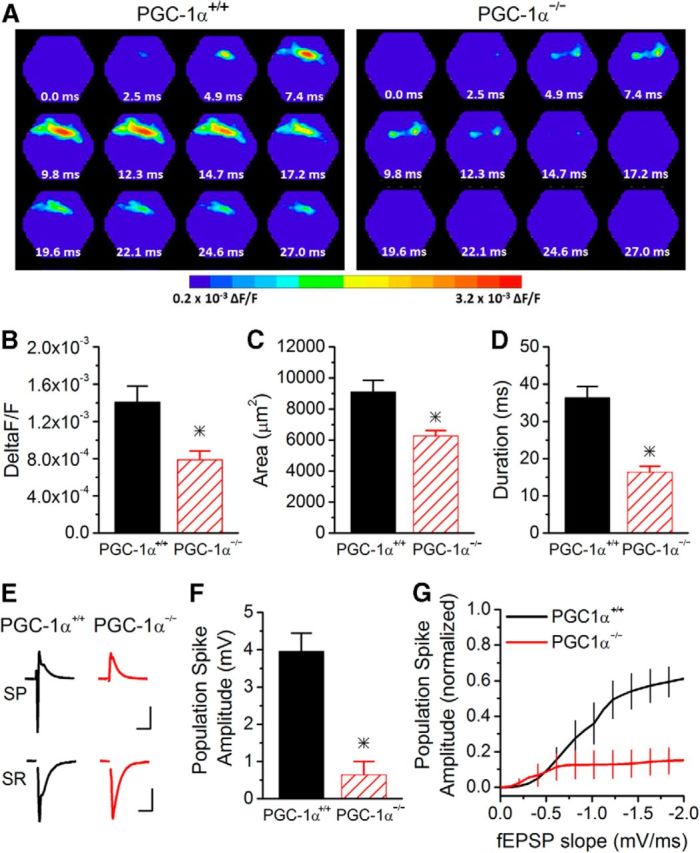
Reduced activation of CA1 hippocampal circuit in PGC-1α−/− mice. A, Example images of the spatiotemporal pattern of voltage-sensitive dye signals evoked in CA1 from PGC-1α+/+ and PGC-1α−/− mice. Frames are 2.47 ms apart. B, The maximum amplitude of the response is reduced in PGC-1α−/− mice (n = 14, 9). C, The spread of the response is reduced in PGC-1α−/− mice (n = 14, 9). D, The duration of the response is reduced in PGC-1α−/− mice (n = 14, 9). E, Example traces of field recording in stratum pyramidale and stratum radiatum from PGC-1α+/+ (black) and PGC-1α−/− (red) mice. Scale bars, 15 ms, 1 mV (top and bottom). F, Population spike amplitudes were measured in stratum pyramidale. The maximum population spike generated in PGC-1α−/− mice (n = 6) was dramatically reduced compared with PGC-1α+/+ mice (n = 9). G, EPSP-spike coupling was measured in response to stimulation of Schaffer collateral axons. The average Boltzmann curve for each group is displayed. In PGC-1α−/− mice, the output from CA1 pyramidal cells was greatly reduced (ANOVA, F(14, 749) = 80.28, p < 0.001, n = 9, 6). *p < 0.05, Student's t test.