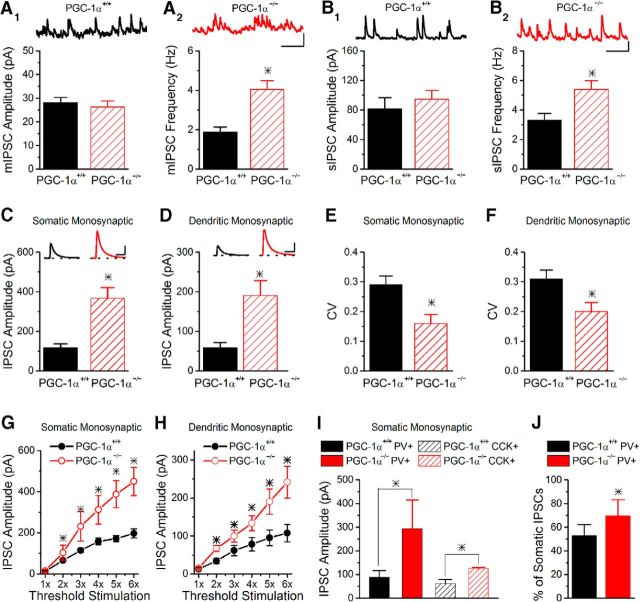
Figure 3.
Inhibitory synapses are altered by the loss of PGC-1α. A, The amplitude of mIPSCs is not altered (A1, n = 10, 6). However, the frequency of the mIPSCs is enhanced in PGC-1α−/− mice (A2, n = 10, 6). Insets, Example traces of mIPSCs onto CA1 pyramidal cells from PGC-1α+/+ (black) and PGC-1α−/− (red) mice. Scale bars, 200 ms, 25 pA. B, Similar to the mIPSCs, the amplitude of the sIPSCs is unchanged (B1, n = 11, 13), whereas the frequency of the sIPSCs is enhanced in PGC-1α−/− mice (B2, n = 11, 13). Insets, Example traces of sIPSC onto CA1 pyramidal cells from PGC-1α+/+ (black) and PGC-1α−/− (red) mice. Scale bars, 200 ms, 50 pA. C, D, Evoked monosynaptic inhibition is enhanced from both somatic (C, n = 12, 8) and dendritic (D, n = 19, 11) targeting interneurons in slices from PGC-1α−/− mice. Monosynaptic IPSCs were generated from stimulation in stratum radiatum near the stratum pyramidale (somatic, left) and near stratum lacunosum moleculare (dendritic, right). Insets, Example traces of evoked monosynaptic IPSCs onto CA1 pyramidal cells held at 0 mV from PGC-1α+/+ (black) and PGC-1α−/− (red) mice. Scale bars, 50 ms, 200 pA. E, F, The CV of monosynaptic IPSCs is reduced in PGC-1α−/− mice for both somatic IPSCs (E, n = 12, 8) and dendritic IPSCs (F, n = 14, 12). G, H, Input/output curves for monosynaptic IPSCs indicate that the peak IPSC amplitude is larger in slices from PGC-1α−/− mice at all stimulation amplitudes above threshold for both somatic (G, ANOVA, F(7, 44) = 11.25, p < 0.002, n = 4, 4) and dendritic (H, ANOVA, F(7, 44) = 10.04, p < 0.003, n = 4, 4) targeting interneurons. I, There are two main classes of somatic targeting interneurons, parvalbumin (PV) and CCK basket cells. Inhibition from each subtype can be pharmacologically isolated by application of either 1 μm WINN or 500 nm DAMGO, respectively. Somatic monosynaptic IPSCs from PV (n = 5, 4) and CCK (n = 3, 3) interneurons have larger amplitudes in slices from PGC-1α−/− mice. J, The percentage of the somatic monosynaptic IPSC that is from parvalbumin cells is larger in PGC-1α−/− mice (n = 8, 7). *p < 0.05, Student's t test.

