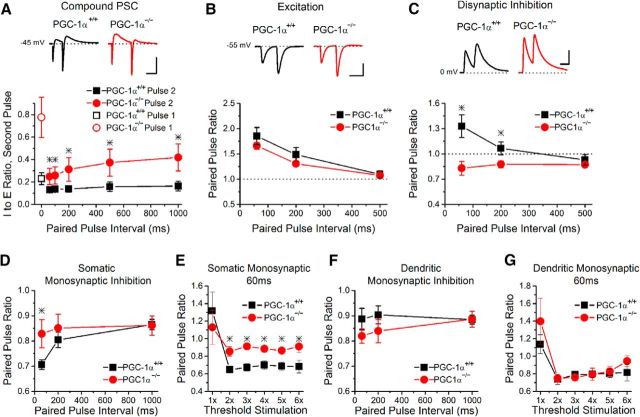
Figure 5.
Alteration in the I/E ratio is frequency dependent in PGC-1α−/− mice. A, The I/E ratio of the second pulse in response to paired-pulse stimulation is larger in slices from PGC-1α−/− mice compared with PGC-1α+/+ mice across a range of interpulse intervals. However, the magnitude of the difference between PGC-1α−/− mice and PGC-1α+/+ mice is interval dependent, being smaller at shorter intervals and larger at longer intervals (ANOVA, F(15, 87) = 24.26647, p < 0.001, n = 10, 6). The I/E ratio on the first pulse, which has the largest magnitude of difference between PGC-1α−/− mice and PGC-1α+/+ mice, is shown for comparison (open symbols at time 0 ms). Insets, Example traces of compound PSCs at a 200 ms interval from PGC-1α+/+ (black) and PGC-1α−/− mice (red) measured in CA1 pyramidal cells held at −45 mV. Scale bar, 100 ms, 100 pA. B, The paired-pulse ratio of the excitation is unchanged (ANOVA, F(24, 72) = 2.40803, p = 0.13, n = 12, 13). Insets, Example traces of EPSCs from PGC-1α+/+ (black) and PGC-1α−/− mice (red) measured in CA1 pyramidal cells held at −55 mV. Scale bar, 50 ms, 100 pA. C, The paired-pulse ratio of disynaptic inhibition shows paired-pulse facilitation in the PGC-1α+/+ mice but shows paired-pulse depression in PGC-1α−/− (ANOVA, F(38, 114) = 15.45, p < 0.001, n = 22, 17). Insets, Example traces of disynaptic IPSCs from PGC-1α+/+ (black) and PGC-1α−/− mice (red) measured in CA1 pyramidal cells held at 0 mV. Scale bar, 50 ms, 200 pA. D, Inhibitory synapses from putative somatic targeting interneurons have less paired-pulse depression with the loss of PGC-1α (ANOVA, F(5, 42) = 3.42, p < 0.02, n = 9, 6). E, The paired-pulse ratio at a 60 ms interval of monosynaptic inhibition from putative somatic targeting interneurons in PGC-1α−/− slices shows less paired-pulse depression compared with PGC-1α+/+ at stimulation intensities greater than threshold (ANOVA, F(7, 44) = 5.42, p < 0.008, n = 4, 4). F, Inhibitory synapses from dendritic targeting interneurons have no significant change in their paired-pulse ratio with the loss of PGC-1α (ANOVA, F(5, 66) = 0.80, p = 0.55, n = 14, 10). G, There is no difference between genotypes in the paired-pulse ratio at a 60 ms interval of monosynaptic inhibition from putative dendritic targeting interneurons across a range of stimulation intensities (ANOVA, F(7, 44) = 0.93, p = 0.34, n = 4, 4). Paired-pulse ratios are calculated as the amplitude of response 2/amplitude of response 1. *p < 0.05.

