Figure 1.
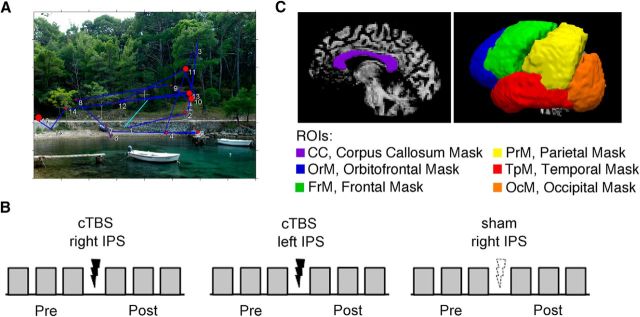
Study design. A, Participants performed a free visual exploration task (example of a visual picture display with a visual scanpath) while their eye movements were recorded. The cumulative fixation duration (i.e., the sum of the duration of all fixations) on the left and the right screen half was computed for each participant during each testing session at two time points (pre and post stimulation). B, Schematic representation of the three testing sessions for each participant (counterbalanced order): with cTBS over the right IPS (left), with cTBS over the left IPS (central), and with sham stimulation over the right IPS (right). Gray rectangles represent blocks of the free visual exploration task before (Pre) and after (Post) stimulation application. Bolt symbols represent stimulation: real cTBS (solid symbols) and sham stimulation (dotted symbol). C, Location and delineation of regions of interest (ROIs) used in spherical deconvolution tractography (see Materials and Methods section for full details).

