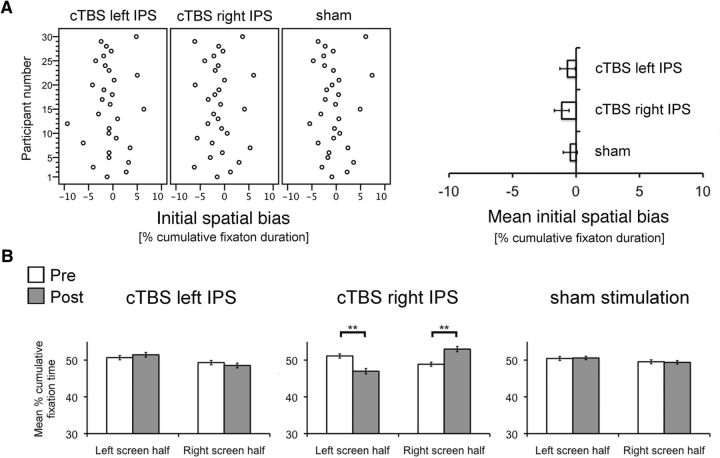
Figure 2.
A, Initial spatial bias (i.e., at time point pre; percentage cumulative fixation duration) across testing sessions in individual participants (left) and at a group level (right). Negative values indicate a leftward bias; positive values indicate a rightward bias. Bars indicate the SEM. B, Mean percentage cumulative fixation time at a group level on the right and the left screen halves, pre and post stimulation, in the condition with cTBS over the left IPS (left), cTBS over the right IPS (central), and sham stimulation over the right IPS (right). Error bars indicate SEM. Asterisks denote significant post hoc tests (**p < 0.01).

