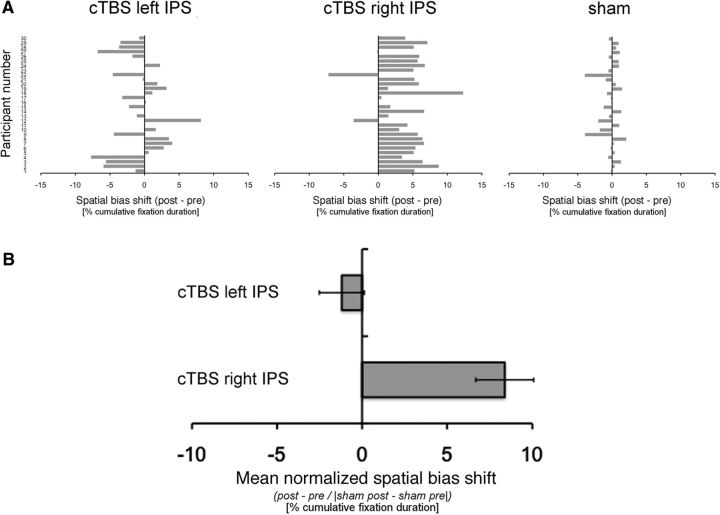
Figure 3.
A, Individual bias spatial shifts (post − pre percentage cumulative fixation durations on the right screen half) after cTBS over the left IPS (left), after cTBS over the right IPS (central), and after sham stimulation (right). Positive values indicate a rightward shift; negative values indicate a leftward shift. B, Mean normalized spatial bias shift (calculated as follows: post minus pre spatial bias shift divided by the absolute value of the difference between post minus pre sham condition) after cTBS over the left IPS and cTBS over the right IPS. Positive values indicate a rightward shift; negative values indicate a leftward shift. Error bars indicate SEM.

