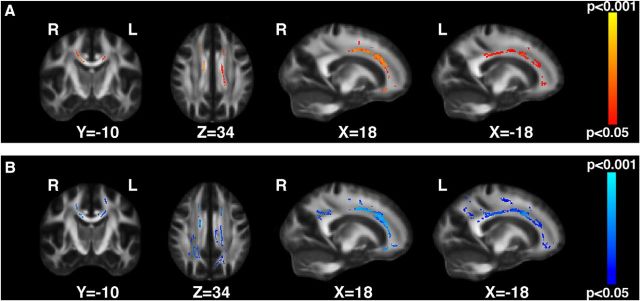
Figure 5.
Results of TBSS group analyses. Higher FA in the corpus callosum in participants with leftward versus rightward attentional shifts after cTBS over the left IPS (presented in red-yellow; A) and with “typical” versus “atypical” overall responses to cTBS as predicted by Kinsbourne's (1987, 1993) model (i.e., a rightward attentional shift after cTBS over the right IPS cTBS, and a leftward attentional shift after cTBS over the left IPS; presented in blue-light blue; B). All results are presented after correction for multiple comparisons (p < 0.05). The results are displayed on the FSL FA template in the standard MNI space with given X, Y, and Z coordinates. L, Left; R, right. Only parts of the TBSS skeleton where significant effects (p < 0.05) were found are shown. The colors depict p-values.

