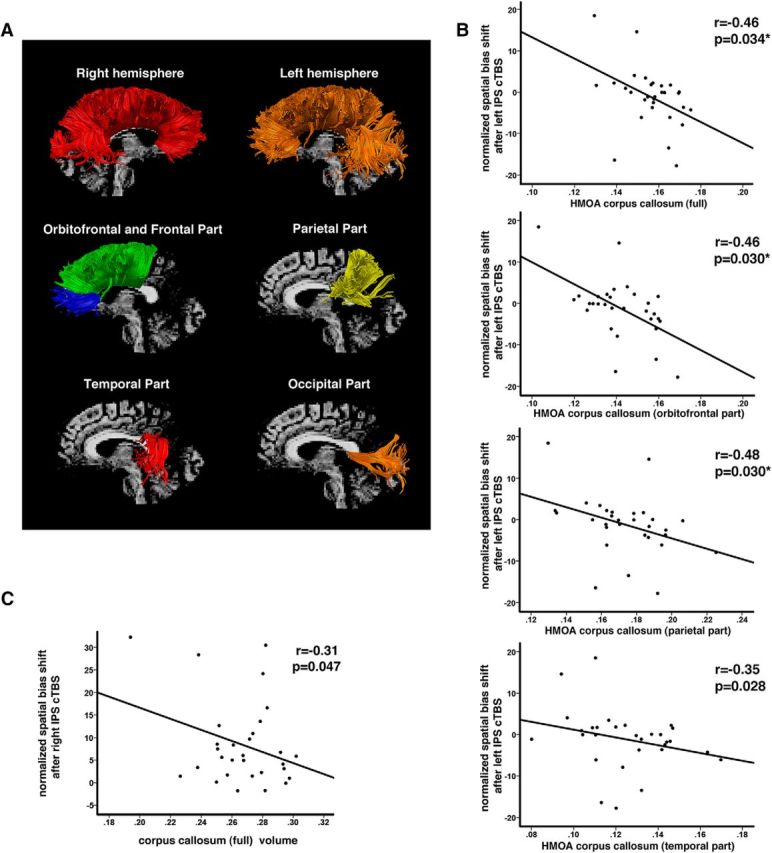
Figure 6.

Results of spherical deconvolution tractography. A, Examples of spherical deconvolution tractography reconstruction of the entire corpus callosum (top) and of different callosal parts: orbitofrontal (blue), prefrontal/frontal (green), parietal (yellow), temporal (red), and occipital (orange). B, Correlations between HMOA measures within the corpus callosum and the effect of cTBS over the left IPS (i.e., normalized shift in the allocation of spatial attention/normalized spatial bias shift). C, Correlations between normalized volume of the corpus callosum and the effect of cTBS over the right IPS (i.e., normalized shift in the allocation of spatial attention/normalized spatial bias shift). Negative values indicate leftward and positive rightward shift in the allocation of spatial attention after cTBS. *Correlation is significant after correction for multiple comparisons (FDR-corrected p-values).
