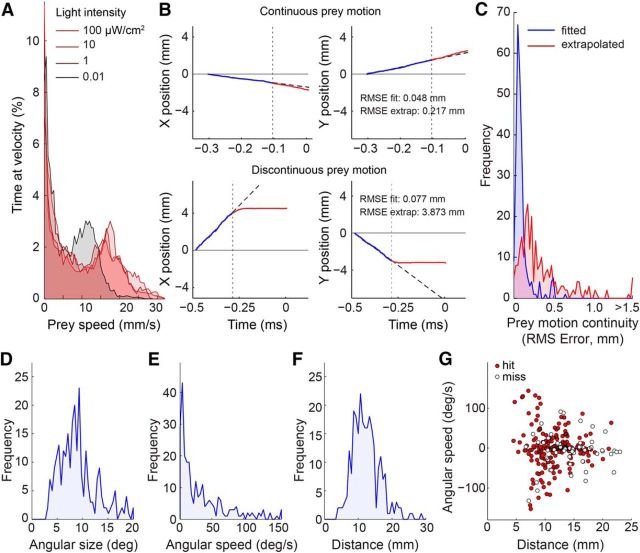
Figure 2.
Prey motion trajectories are diverse but often predictable. A, Distribution of prey speed at different light levels. At each light level, the distribution was bimodal with a zero and non-zero peak, indicating that flies alternated between stationary and walking periods. B, Computation of prey motion continuity for two sample fly trajectories leading up to tongue projection. Prey motion was divided into two time segments relative to capture onset (vertical dotted line): the pre-capture phase (200 ms of motion before capture onset; blue line), and the capture phase (motion during prey capture until the tongue was fully extended; red line). A linear fit (dashed black line) to prey motion in the pre-capture phase was used to predict prey position in the capture phase. Prey motion continuity was defined as the RMS error between the extrapolated fit and the observed prey motion trajectory (red). C, Histogram of motion continuity across all recorded projections. Low RMS error indicates predictable prey motion with little deviation from its pre-capture trajectory. RMS error of the linear fit (blue segment in B) included for reference. Most trajectories were predictable to <0.5 mm error (a fly is ∼3 mm in length and moves ∼3 mm during a typical capture phase). D, Distribution of prey angular size on the salamander retina at the onset of prey capture. E, Distribution of prey angular speed at the onset of prey capture. F, Distribution of prey distance from the salamander at the onset of prey capture. G, Prey distance and angular speed across all projections. Positive and negative values indicate opposite directions of motion. Successful captures (hits, red circles) and failed captures (misses, open circles) are broadly distributed across the parameter space.

