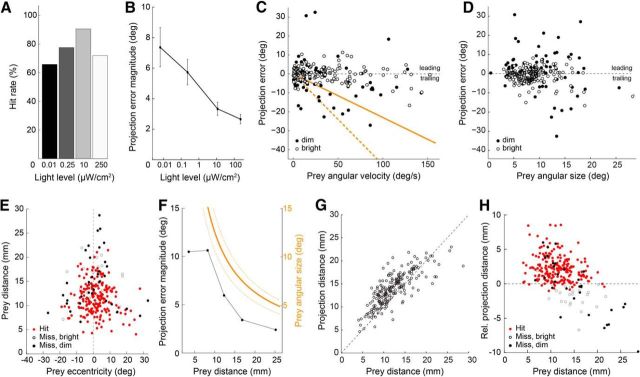
Figure 3.
Tongue projection accuracy is robust across a wide range of illumination and prey motion conditions. All panels: n = 268. A, Prey capture success rate from dim through bright light levels (scotopic through photopic; 4.5 log10-unit range). B, Magnitude of the angular error across all tongue projections at the light levels in A. Data include both hits and misses. C, Scatter plot of the projection error as a function of prey angular velocity at the time of projection onset. Orange lines indicate the projection error that would result if the salamander aimed at a delayed prey image with a 230 ms (solid) and 480 ms (dashed) visuomotor lag. D, Scatter plot of projection error as a function of prey angular size. E, Scatter plot of prey distance versus prey eccentricity relative to the salamander's visual mid-line (vertical dashed line) for all recorded projections. Nearby prey evoked tongue projections at eccentricities up to 25°, whereas distant prey evoked projections only when located within a few degrees of the midline. F, Comparison of the angular projection error (black) and prey angular size (orange; average size, solid line; maximum and minimum size, orange dashed line) as a function of prey distance. Tongue projection error decreased with increasing prey distance, such that at most distances the angular error was approximately twofold smaller than prey angular size. G, Scatter plot of the tongue projection distance versus prey distance (see Materials and Methods; Fig. 1). H, Scatter plot of relative projection distance (tongue tip distance to prey distance). The tongue typically overshot the prey by ∼2.5 mm; at the brightest light level, projections increasingly often landed short of the prey (open circles).

