Figure 7.

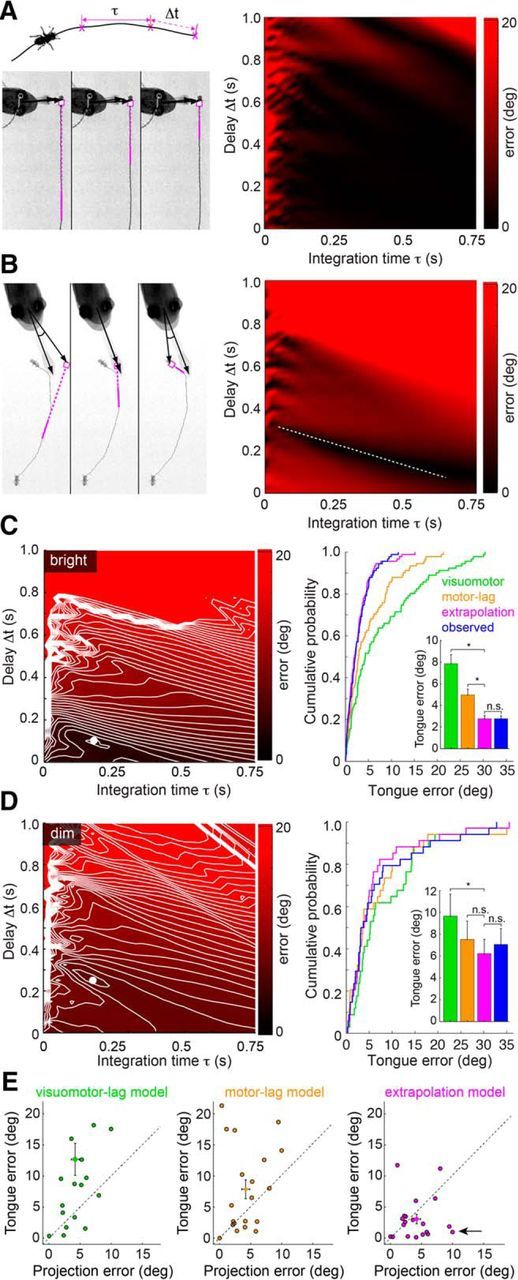
Linear extrapolation of prey trajectory predicts tongue position to within behavioral variability. A, Left, Top, Schematic representation of extrapolation model, showing the prey movement, integration window (τ), and visual latency (Δt) used to compute the predicted prey location. Left, Bottom, Example of a tongue projection to a prey with near-constant velocity on a continuous trajectory. Panels represent the extrapolated prey trajectory for three different integration time (τ) and delay (Δt) combinations (magenta line indicates integration time window). For each combination, this continuous prey trajectory results in the same predicted future prey location (magenta circle). Right, Surface plot of tongue position error (angular difference between the tongue and extrapolated prey location) demonstrating that most parameter combinations for continuous prey trajectories give a similar error. B, Left, Discontinuous prey trajectories yield diverse extrapolated prey positions as a function of τ and Δt. Right, Surface plot of tongue position error demonstrating that the discontinuous trajectory generates minima at a limited set of τ and Δt combinations (dashed white line). C, Tongue position error surface and extrapolation model performance for bright light projections (2–250 μW/cm2; see Materials and Methods). Left, Error surface showing a strong minimum in extrapolation model error (τ = 175 ms, Δt = 100 ms). Right, Cumulative probability distribution function of errors for the visuomotor-lag, motor-lag, extrapolation model, and observed projection errors in predicting tongue position. The visuomotor-lag model aimed at the prey 100 ms before the head turn. The motor-lag model aimed at prey at the moment of the head turn. The extrapolation model has considerably lower error than either nonpredictive model, and estimated the tongue location approximately equally well as the observed prey position (inset, bar plot). Significance for paired t tests: visuomotor-lag versus extrapolation, p < 0.0001; motor-lag versus extrapolation, p < 0.0001; extrapolation versus observed, p = 0.96. D, Tongue position error surface and performance for dim light projections (0.01–0.2 μW/cm2; see Materials and Methods). Left, Error surface showing a strong minimum in extrapolation model error at (τ = 250 ms, Δt = 100 ms). Right, Cumulative probability functions as in C. The visuomotor-lag model aimed the prey 350 ms before the head turn. The motor-lag model aimed at prey at the moment of the head turn. The extrapolation model has considerably lower error than either nonpredictive model and often estimates the tongue position better than the observed final prey position (inset, bar plot). Significance for paired t tests: visuomotor-lag versus extrapolation, p = 0.046; motor-lag versus extrapolation, p = 0.27; extrapolation versus observed, p = 0.32. * indicates significant differences; n.s., not significant. E, Scatter plots of observed projection error (angle between the measured final positions of tongue and prey) versus the tongue model error (angle between measured tongue position and tongue position computed from each model). Errors are plotted in absolute value, using data from the 20 most discontinuous prey trajectories. Arrow indicates tongue positions that are explained better by extrapolated prey location than actual prey location.
