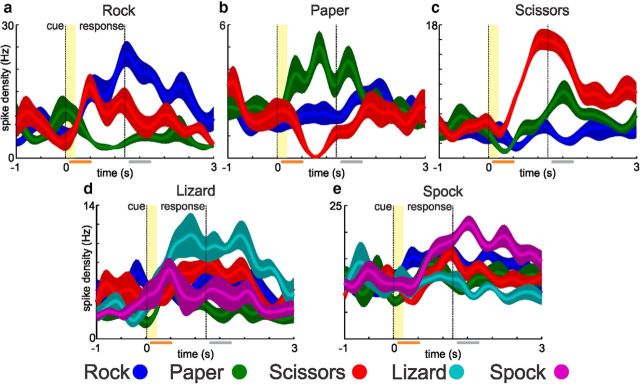
Figure 2.
Example motor-imagery neurons. a–c, Top row, Example neurons from the RPS and the bottom row (d, e) neurons from the RPSLS task. Each plot shows the average firing rates (solid line; shaded area = SD) for 10 trials of each cued symbol during the task. Vertical lines indicate the onset of the cue (yellow shading = time period during which the cue symbol was visible) and response phase. Selection criterion for neurons was significant tuning for one of the cue symbols during the response time window (gray bar; see Materials and Methods). The orange bar shows the cue time window, in which only the paper neuron is also tuned.

