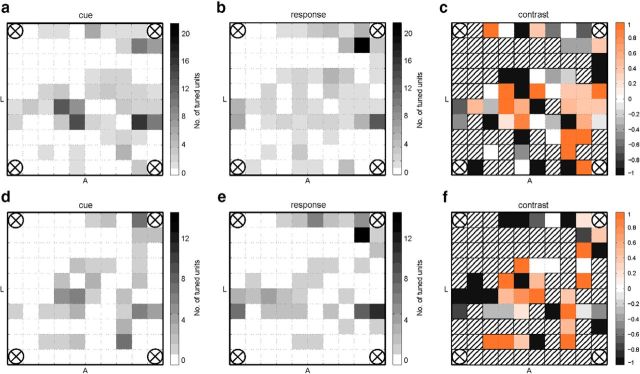
Figure 5.
Spatial distribution of tuned units on the AIP array. Total number of tuned units per channel (electrode) on the array (top down view onto the pad) in the RPS (a, b) and the RPSLS (d, e) tasks. Tuned units are shown for the cue (a, d) and response (b, e) phases. The electrodes in the four corners of the array were used as references. Orientation of the array on the cortex is indicated by the letters A (anterior) and L (lateral). The contrast plots show how many units were tuned for the cue phase relative to the response phase for the RPS (c) and RPSLS (f) tasks. A contrast ratio of 1 means that all units found on the channel were only tuned for the cue phase and a value of −1 means that all units were only tuned in the response phase. Striped channels in the contrast plots mean that no tuned units were recorded on the channel. Contrast was calculated as c = , where tc is the number of tuned cells during the cue phase and tr is the number of tuned cells during the response phase.

