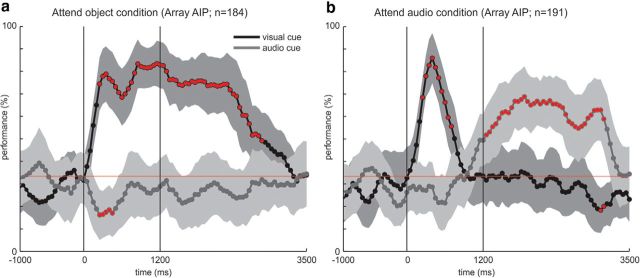
Figure 6.
Continuous decoding performance during the CC task. E.G.S. was either instructed to attend and respond to the visual cue (a) or the auditory cue (b). Feature n is the number of units recorded over eight sessions that were used by the decoder. Solid black lines show the decoder mean performance when decoding the visual cue and dark gray lines show the decoder mean performance when decoding the audio cue. Shaded areas show SE for decoding. Red circles indicate significant (p < 0.01) deviation of decoding performance compared with chance level (red line). Vertical lines indicate the onset of cue and response phases.

