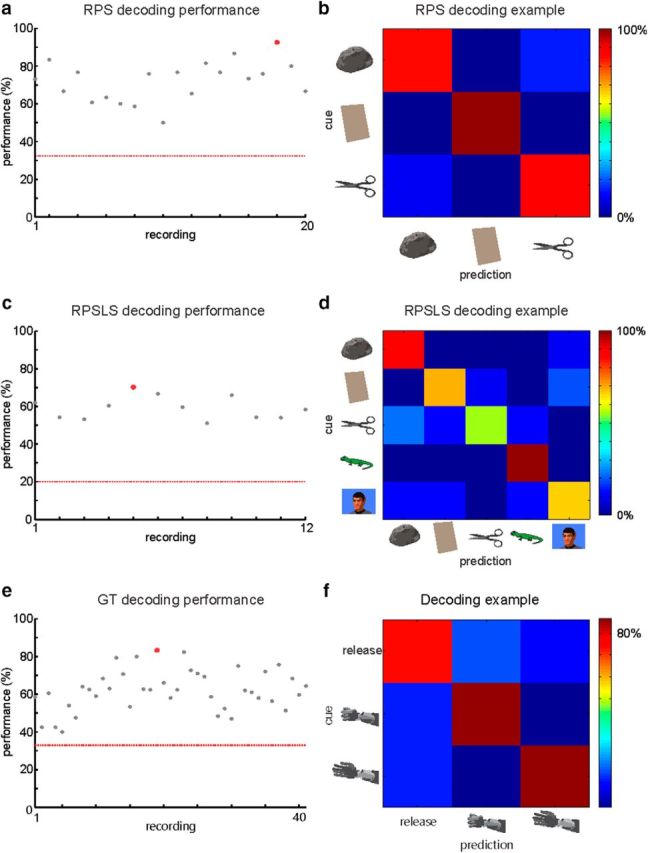
Figure 7.

Off-line decoding analysis of the RPS, RPSLS, and GT tasks. Decoding performance for each recording for the RPS (a), RPSLS (c), and GT (e) tasks. Red line indicates chance level for each task. Example confusion matrices for recordings from the RPS (b), RPSLS (d), and GT (f) tasks. Examples are marked as red dots in the performance plots.
