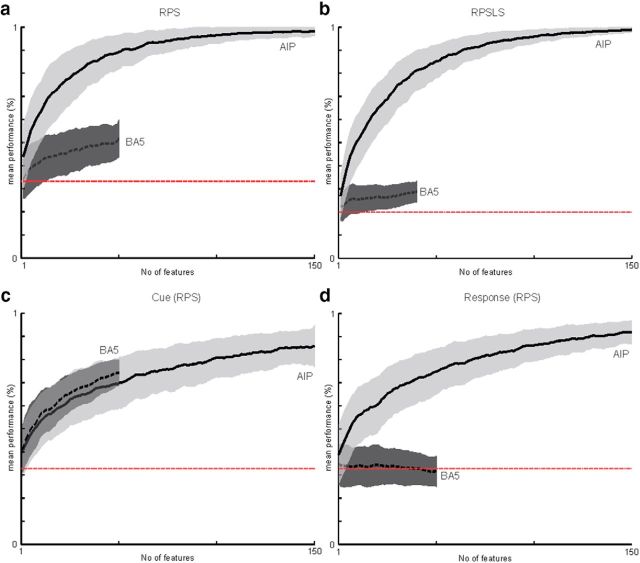
Figure 8.
Neuron-dropping analysis. Neuron-dropping curves are shown for the RPS (a) and RPSLS (b) tasks using the 1500 ms time window (see Materials and Methods). Neuron-dropping curves are shown for the AIP (solid line) and BA5 (dashed line) arrays separately. Red line shows chance level for the task. Shaded areas show SD. Each data point was created using a 1000-fold cross-validation (see text). Separate neuron-dropping analyses for the cue (c) and response (d) phases used 400 ms time windows aligned to the corresponding phase (see “Neuron-dropping analysis”).

