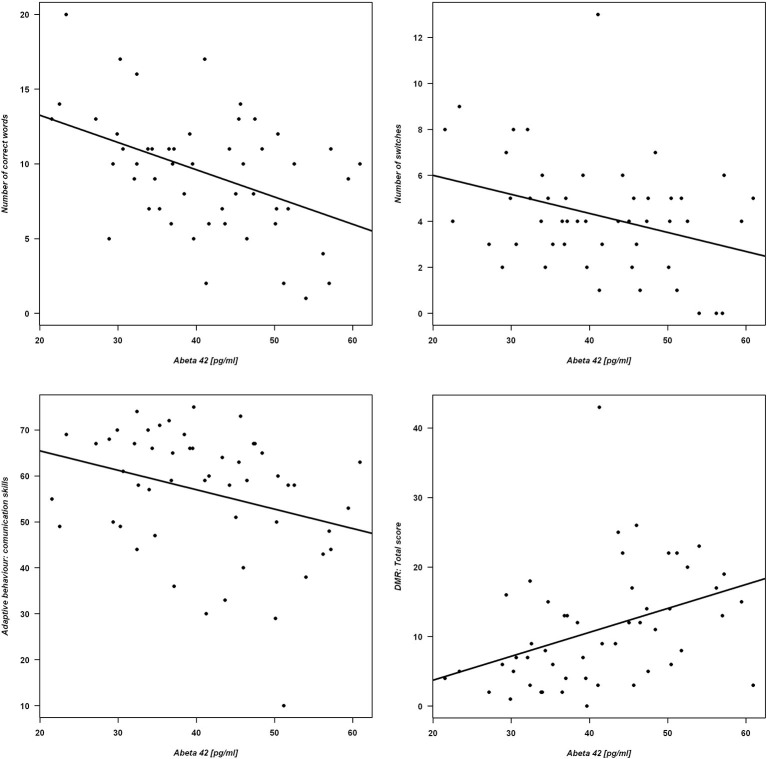
Figure 1.
Verbal fluency and functional measures as a function of Aβ42 concentration. Correlations are shown for Aβ42 and Upper panel: number of correct words (left) and number of switches (right). Lower panel: ABAS adaptive behavior (left) and DMR total score (right). The figures include the regression lines from the corresponding linear regression models.

