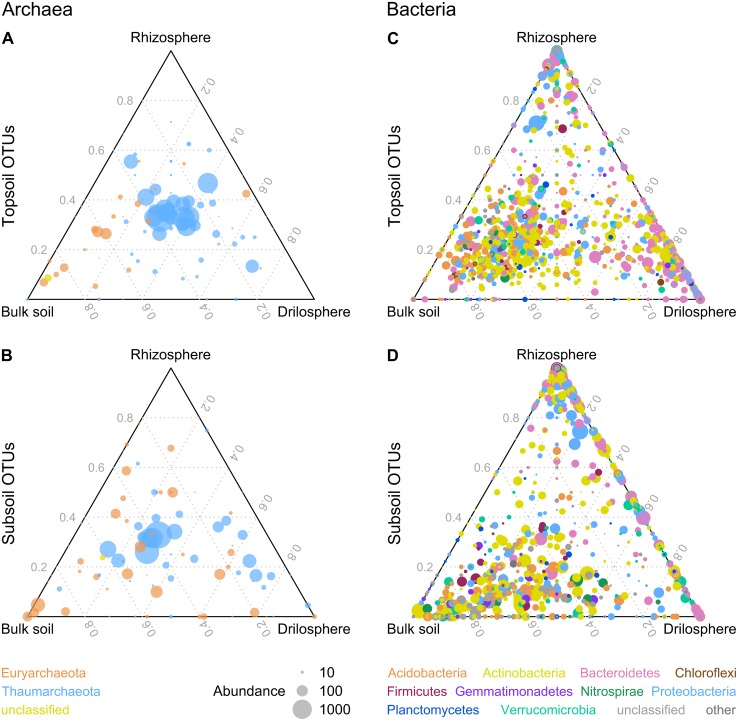
Figure 3.
Distribution of archaeal (A,B) and bacterial (C,D) OTUs between soil compartments in ternary plots. OTUs with a higher abundance in topsoil or subsoil are displayed in (A,C) or (B,D). Similarity level is 95% and only OTUs with a minimum absolute abundance of 5 are shown. The size of the dots represents the absolute abundance of one OTU.

