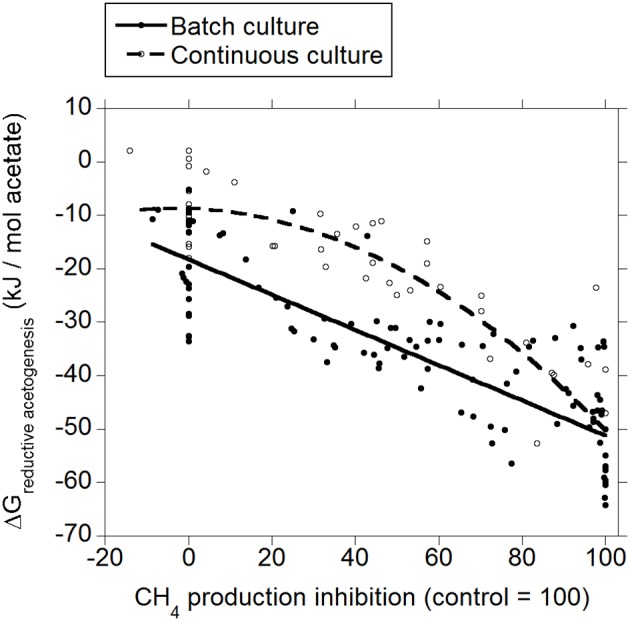
Figure 4.

Response of Gibbs energy of reductive acetogenesis (ΔGreductive ace to genesis) to the inhibition of CH4 production expressed as a percentage of CH4 production decrease relative to control treatments. Treatment means are adjusted by the effect of their experiment. Batch culture: y = −18.2 (±2.43; p < 0.001) + exp (p < 0.001) − 0.33 (±0.038; p < 0.001) x + exp × x (p < 0.001); R2 = 0.93 (p < 0.001); Continuous culture: y = −0.16 (±2.97; p = 0.96) − 0.39 (±0.044; p < 0.001) x − 0.0039 (±0.0014; p = 0.011) (x − 46.7)2 + exp × x (p = 0.045); R2 = 0.85 (p < 0.001).
