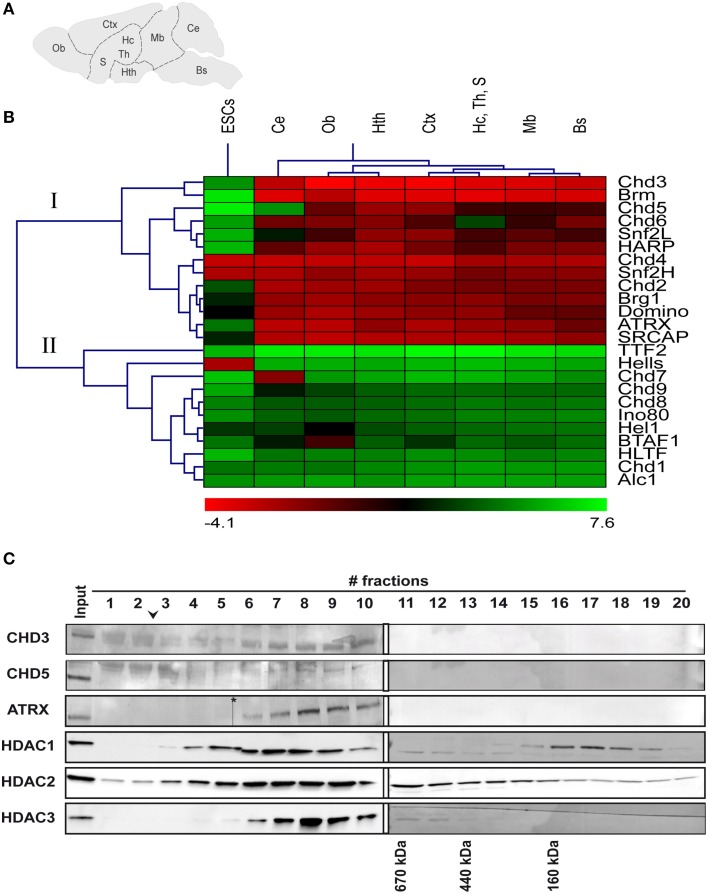
Figure 1.
mRNA expression and protein complex formation of various ChRFs in the brain and in embryonic stem cells (ESCs). (A) Schematic of regions that were assessed for RNA levels of several ChRFs: Bs, brain stem; Ce, cerebellum; Mb, midbrain; Hth, hypothalamus; Hc, Th, S, hippocampus/thalamus/septum; Ctx, cortex; and Ob, olfactory bulb. (B) ChRFs fall into two large expression groups (I + II) in the brain. RT-qPCR results were expressed as ΔCT values (reference gene: Gapdh) which were then centered at the median and subjected to hierarchical clustering. Red color indicates high expression (negative ΔCT value) and green color indicates low expression (positive ΔCT value). (C) Superose 6 size exclusion chromatography of ChRF peak fractions after anion exchange chromatography followed by immunoblot analysis of CHD3, CHD5, and ATRX as well as HDAC1, 2, and 3. The arrowhead indicates the void volume of the column, the asterisk marks a scanning artifact. Molecular masses of defined marker proteins are indicated at the bottom of their corresponding elution fractions.

