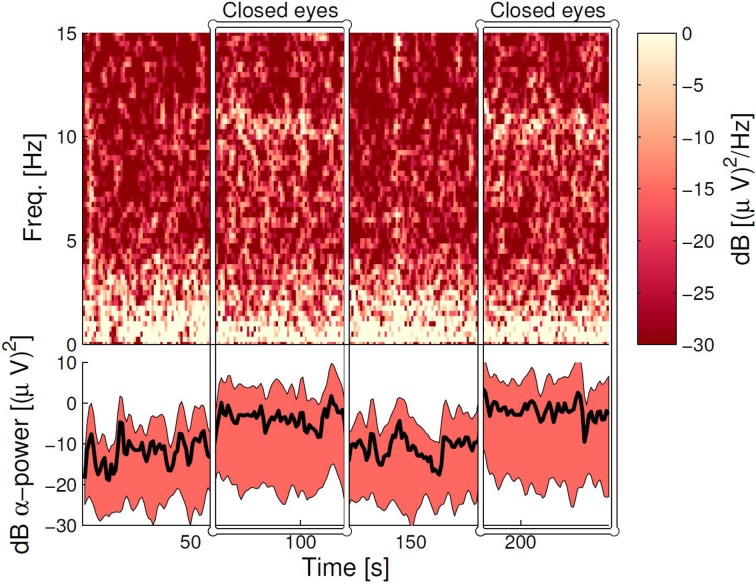
Figure 8.
The α-band power during the α-attenuation paradigm for the ELE channel. Top panel: the spectrogram for a specific subject, where each column shows the power spectrum for a 4-s data segment. Neighboring columns have time offset by 1 s (meaning 3 s overlap). Bottom panel: Averaged power in the 8–12 Hz band, averaged over all subjects. The wide band demarcates the area between 15 and 85% percentiles, and has been smoothed with a moving average filter of 5 s width. The line within the band shows the grand average, not smoothed. In both panels, the dB scale is relative to 1 (µV)2/Hz.

