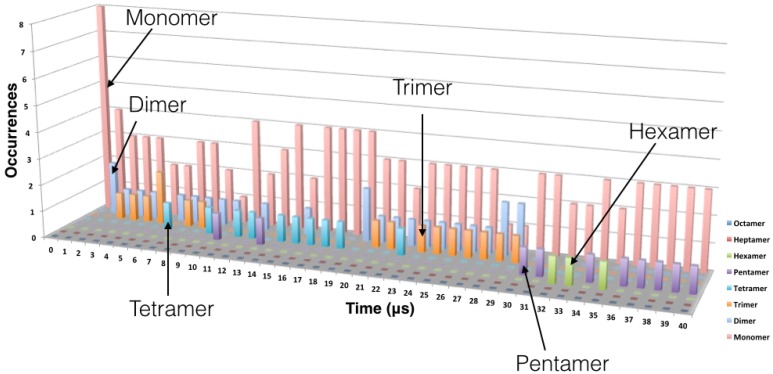
Figure 3.
Evolution of the oligomer formation as a function of time. Oligomerization was measured every microsecond. The data shown here is from one replica but is representative of the behavior observed in the other replicas. The monomers are represented in pink, the dimers in cyan, the trimers in orange, the tetramer in blue, the pentamer in violet and the hexamer in green.

