Figure 1.
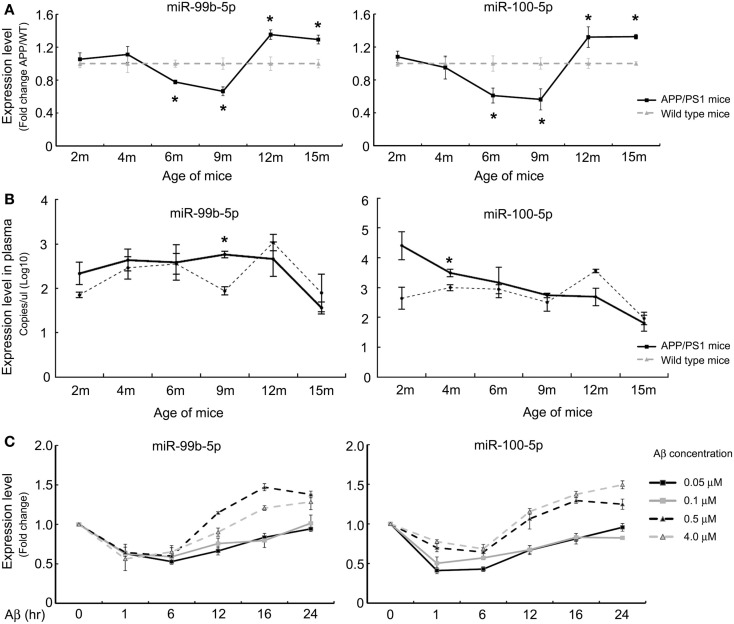
The expression levels of miR-99b-5p and miR-100-5p in APP/PS1 mice and Aβ-treated PC12 cells. (A) Relative expression levels (presented as fold change) of miR-99b-5p/miR-100-5p were quantified in six to eight pairs of APP/PS1 and WT mice cortexes by real-time PCR. The levels were normalized to the expression of snRNAU6 using the delta–deltaCt methods. (B) The absolute copy number of plasma miRNAs were calculated by referring to the standard curve and normalized with the Ct of mmu-miR-486 and cel-miR-238. Data are represented as mean ± SD, results were analyzed with Student’s t test (*p < 0.05, n = 3). (C) PC12 cells were differentiated for 48 h before the treatments with different concentrations of Aβ1–42 oligomers (0.05, 0.1, 0.5, and 4.0 μM) for various time intervals. Relative expression levels of miR-99b-5p and miR-100-5p are represented as fold change compared to vehicle controls. Data are expressed as mean ± SD and results were analyzed with Student’s t test [*p < 0.05, compared with control (n = 6)].

