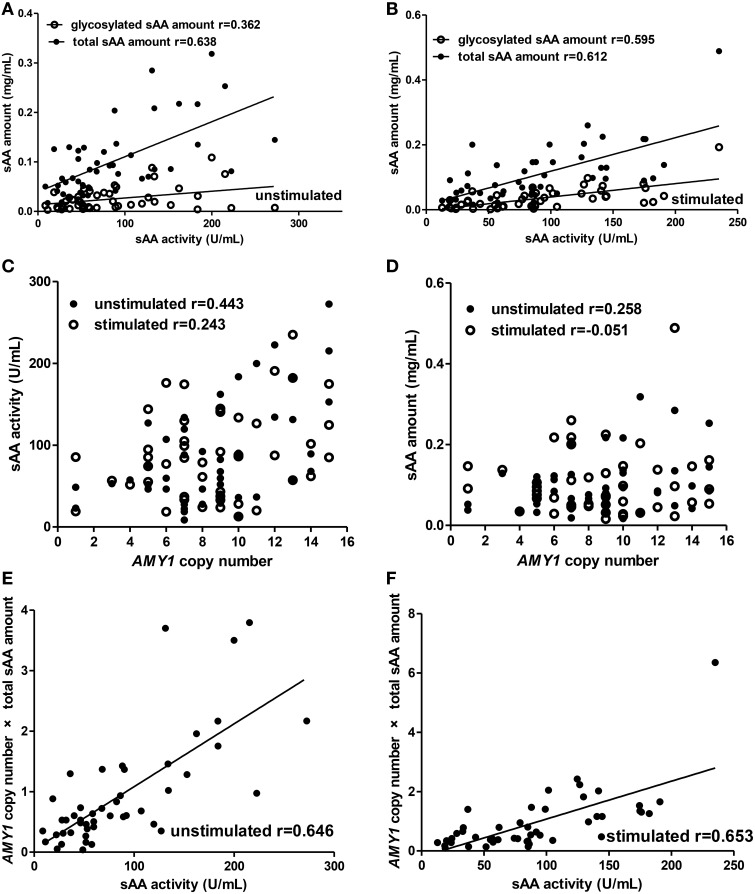
Figure 3.
Correlations among AMY1 copy number, sAA activity, and sAA amount before and after citric acid stimulation in adults. Both total sAA amount (mg/mL) and glycosylated sAA amount (mg/mL) were significantly correlated with sAA activity (U/mL) in unstimulated (A) and stimulated saliva (B). Correlation r between glycosylated sAA amount and sAA activity increased from 0.362 to 0.595 after stimulation. Neither sAA activity (C) nor total sAA amount (D) was correlated with AMY1 copy number in unstimulated or stimulated saliva, except that AMY1 copy number was significantly correlated with sAA activity in unstimulated saliva (r = 0.443). AMY1 copy number × total sAA amount significantly correlated with sAA activity in unstimulated (E) and stimulated saliva (F). Interestingly, the correlation r between AMY1 copy number × total sAA amount and sAA activity was higher than that between AMY1 copy number, total sAA amount and sAA activity in unstimulated and stimulated saliva.

