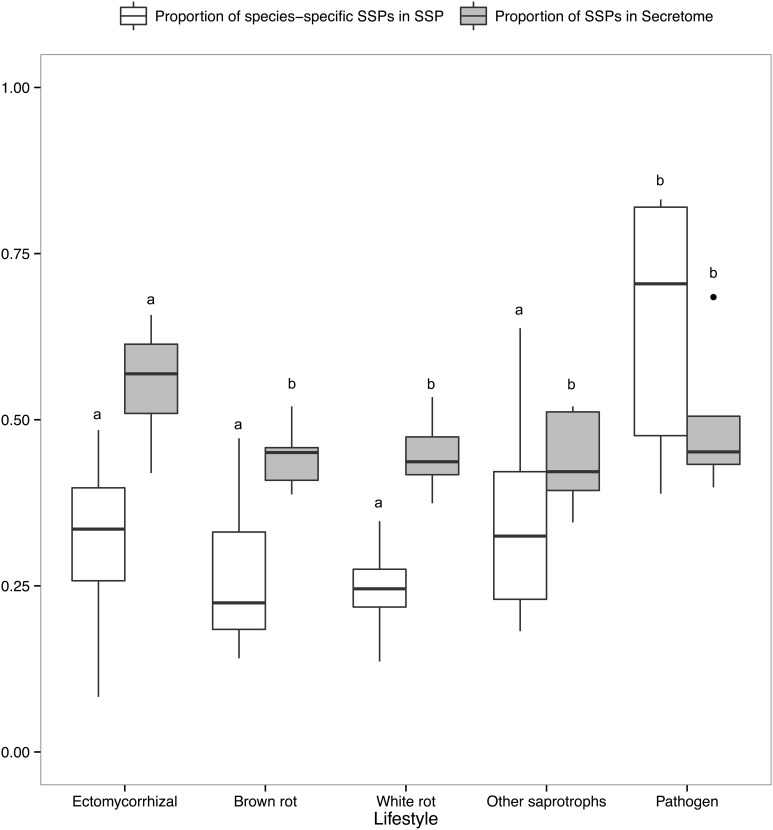
Figure 6.
Proportion of SSPs and species-specific SSPs. Boxplots showing proportion of SSP in secretome across lifestyles (gray) and proportion of species-specific SSPs, defined as SSPs with no homology in other species (white). Different letters shows significant difference (p < 0.01) based on pairwise t-test with holm correction of p-values. Only fungal lifestyles containing at least five fungal species have been taken in account.

