Figure 4.

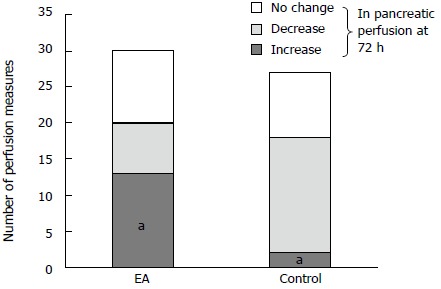
Changes in pancreatic perfusion measurements at 72 h compared to the measurements. On admission in the epidural anesthesia (EA) and control group (significant increase, decrease or no change in perfusion). aP = 0.0025 vs control.

Changes in pancreatic perfusion measurements at 72 h compared to the measurements. On admission in the epidural anesthesia (EA) and control group (significant increase, decrease or no change in perfusion). aP = 0.0025 vs control.