
Figure 2.
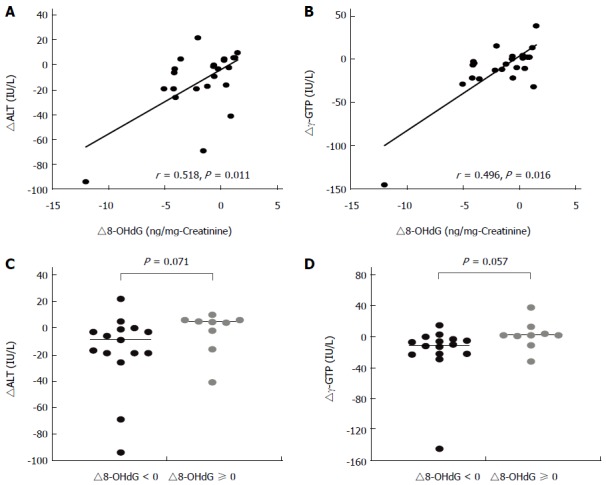
Parallel improvements of an oxidative stress marker and liver function markers in sulforaphane group participants. A, B: Change levels of liver function markers, alanine aminotransferase and γ-glutamyl transpeptidase (∆ALT and ∆γ-GTP) were respectively plotted against changes in levels of urinary 8-hydroxydeoxyguanosine (∆8-OHdG), an in vivo oxidative stress marker, in SF group participants (n = 24). Each circle represents individual data. Spearman r and P were determined; C, D: ∆ALT and ∆γ-GTP were compared between participants with ∆8-OHdG < 0 (n = 15) and ∆8-OHdG ≥ 0 (n = 9). Each circle symbol represents an individual data point. Bars in graphs represent median values. P values were obtained by using the Mann-Whitney U test.