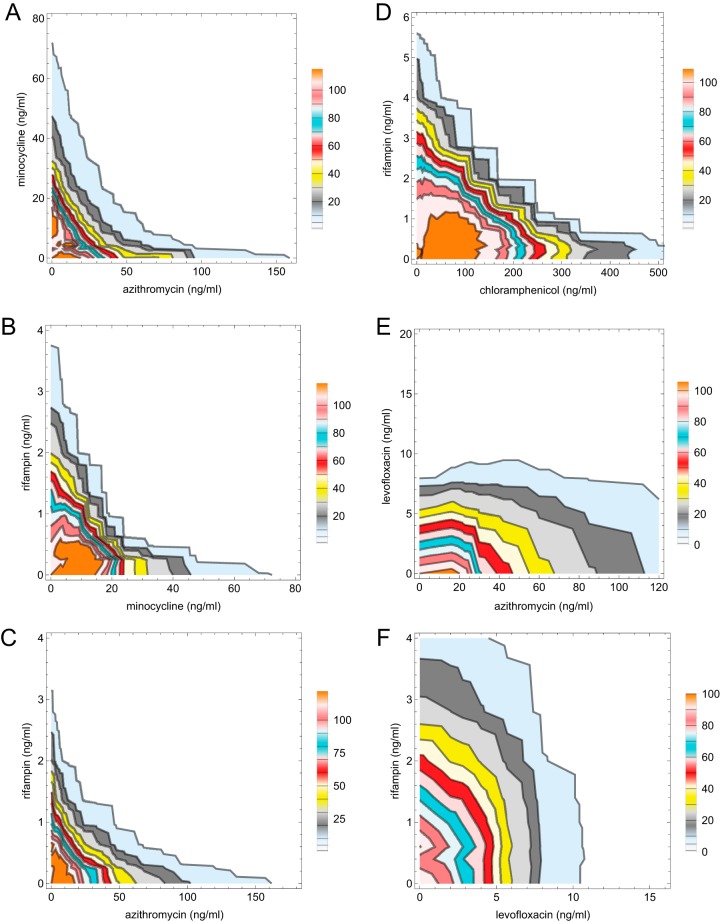
FIG 3.
Isobolograms of minocycline versus azithromycin (A), rifampin versus minocycline (B), rifampin versus azithromycin (C), rifampin versus chloramphenicol (D), levofloxacin versus azithromycin (E), and rifampin versus levofloxacin (F). Isocontours were drawn using Mathematica based on regions of 1, 5, 10, 20, 30, 40, 50, 60, 70, 80, 90, and 100% growth relative to growth in the untreated control. The 99% inhibition contour (1% growth, combinatorial MIC) is the contour line farthest to the right in each plot. Color shading between isocontours was added for clarity. Subinhibitory stimulation of luminescence led to isocontours greater than 100% in some plots. Data points used to generate isocontours were based on the means of three separate test wells per antimicrobial combination.

