
FIG 1.
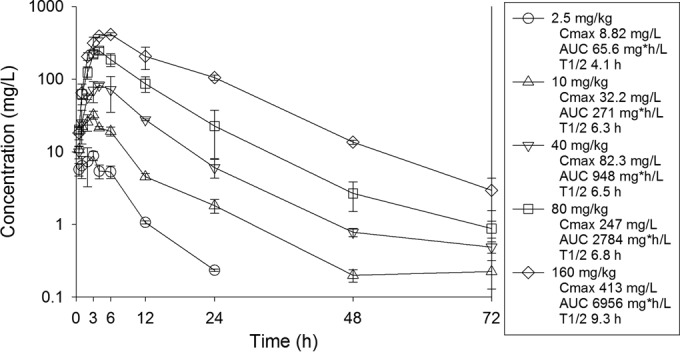
Plasma pharmacokinetics of dalbavancin in mice following intraperitoneal administration. Each symbol represents the mean and standard deviation from three mice. The drug concentration values presented represent total (protein-bound and unbound) drug. The AUC values represent 0 to infinity. Cmax, maximal drug concentration; T1/2, half-life.