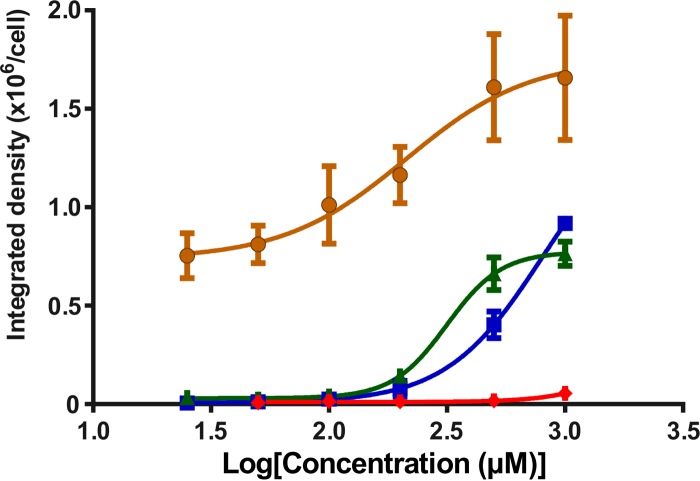
FIG 3.
Plot of the integrated density of each probe per NRK-52E cell (n = 20 cells) from the confocal microscopy imaging data (as exemplified in Fig. 2) against the log concentration (in micromolar). The solid lines represent the best fit to a nonlinear dose-response model. ●, MIPS-9541; ◆, MIPS-9542; ▲, MIPS-9543; ■, MIPS-9544. Data are presented as mean ± SD.

