FIG 1.
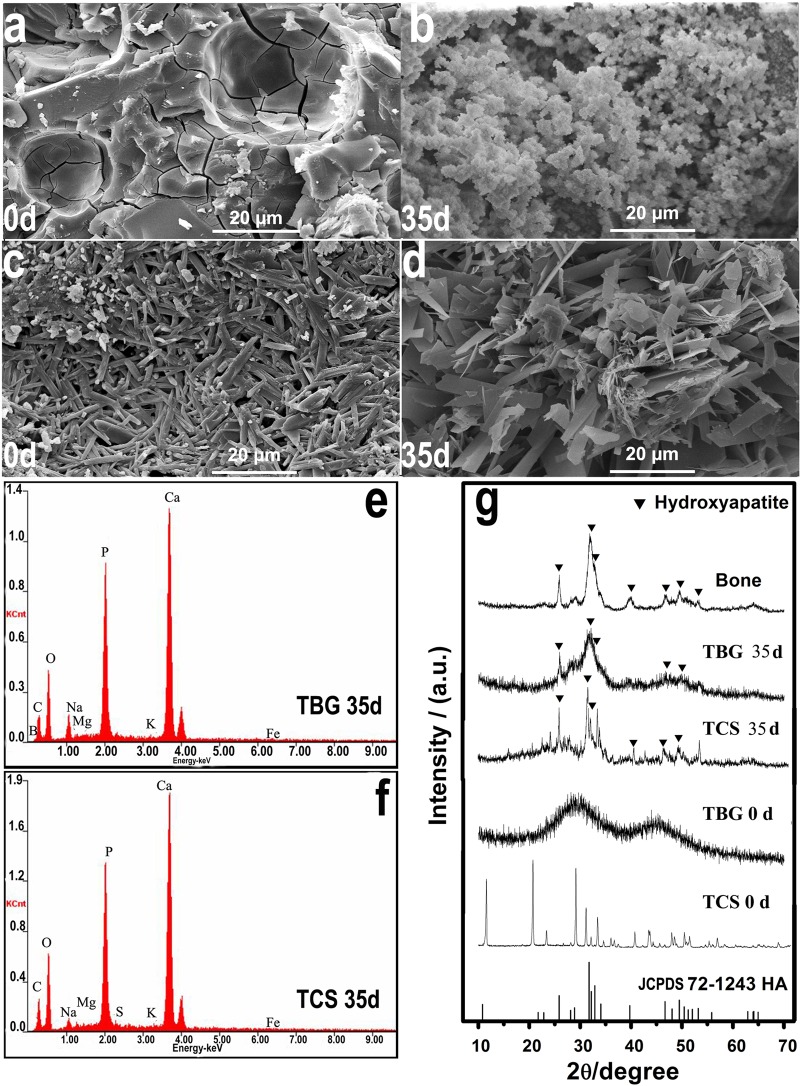
(a to d) SEM micrographs of the surfaces of TBG (a and b) and TCS (c and d) implants as fabricated (designated 0d [day 0]) (a and c) and after immersion in PBS for 35 days (35d) (b and d). (e and f) EDS spectra of the surface of the TBG implant (e) and the TCS implant (f) after immersion in PBS for 35 days. (g) XRD patterns of the TBG and TCS implants as fabricated (0 d) and after immersion in PBS for 35 days. For comparison, the XRD patterns of reference hydroxyapatite (HA) (JCPDS 72-1243) and dry rabbit bone are also shown. a.u., arbitrary units.

