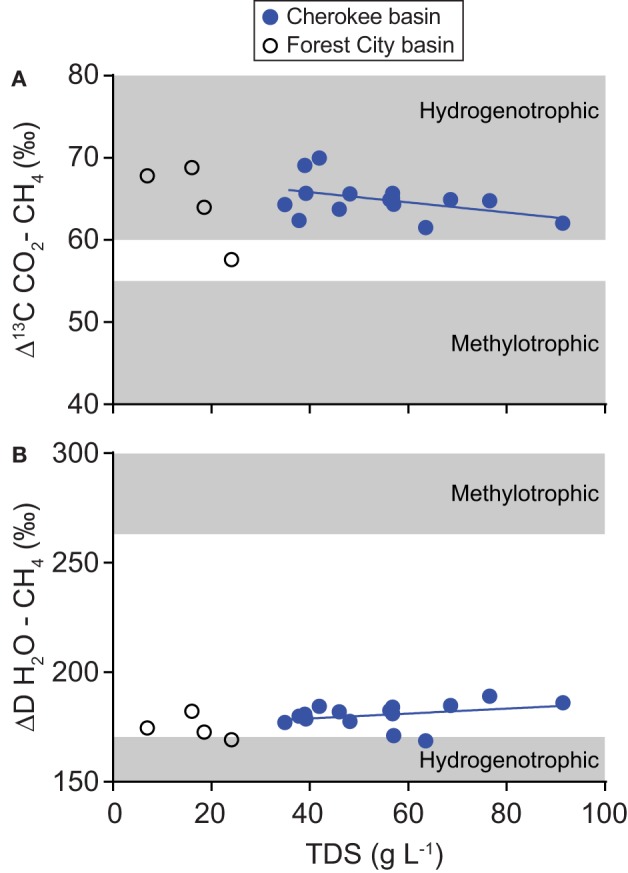
Figure 10.

Variation relative to TDS content in (A) differences between carbon dioxide and methane carbon isotope ratios (Δ13C) and (B) differences between water and methane hydrogen isotope ratios (ΔD). Data were collected from coalbed methane wells in the Cherokee basin (this study) and the Forest City basin (McIntosh et al., 2008). For both basins, we calculated TDS-values using all available solute concentration data. Best-fit lines through Cherokee basin data are shown on each graph.
