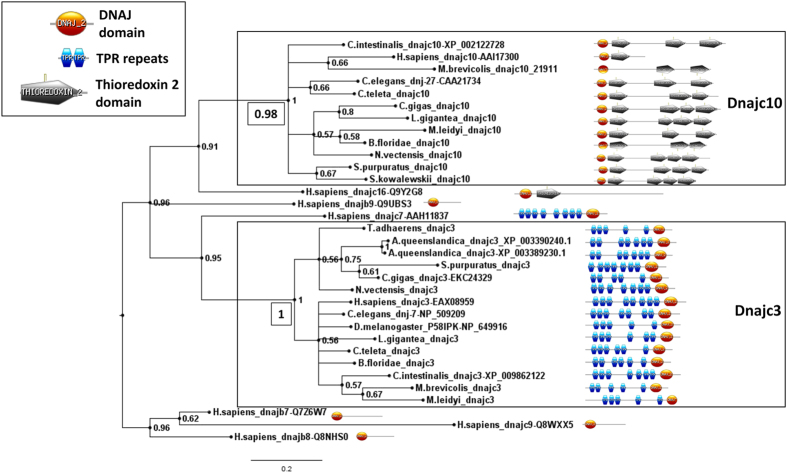
Figure 3. Molecular phylogenetic analysis of prospective dnajc3 and dnajc10 sequences, plus a selection of outgroup DnaJ domain sequences.
The tree shown was produced by Bayesian analysis and values adjacent to nodes are posterior probabilities. Additional values in boxed text next to the nodes uniting the dnajc3 and dnajc10 clades are derived from Maximum Likelihood analysis, and the full tree from which these have been extracted can be seen in Supplementary Fig. S11. The domain structure of each predicted protein is shown on the right. Note the carboxy and amino terminal placement of the DnaJ domain in Dnajc3 and Dnajc10 proteins, respectively. Variable numbers of predicted TPR repeats and Thioredoxin 2 domains may reflect the stringency criteria used in domain prediction and should not be taken as necessarily biologically informative. Diagrams are not to scale. Species included in the figure are Drosophila melanogaster, Caenorhabditis elegans, Homo sapiens, Ciona intestinalis, Branchiostoma floridae (amphioxus), Strongylocentrotus purpuratus (sea urchin), Saccoglossus kowalevskii (acorn worm), Lottia gigantea (mollusc), Crassostrea gigas (mollusc), Capitella teleta (annelid), Nematostella vectensis (anemone), Mnemiopsis leidyi (ctenophore), Amphimedon queenslandica (sponge), Monosiga brevicollis (choanoflagellate). Accession numbers are given for outgroup sequences and sequences from model species, for other sequence sources please refer to Supplementary Table S5.

