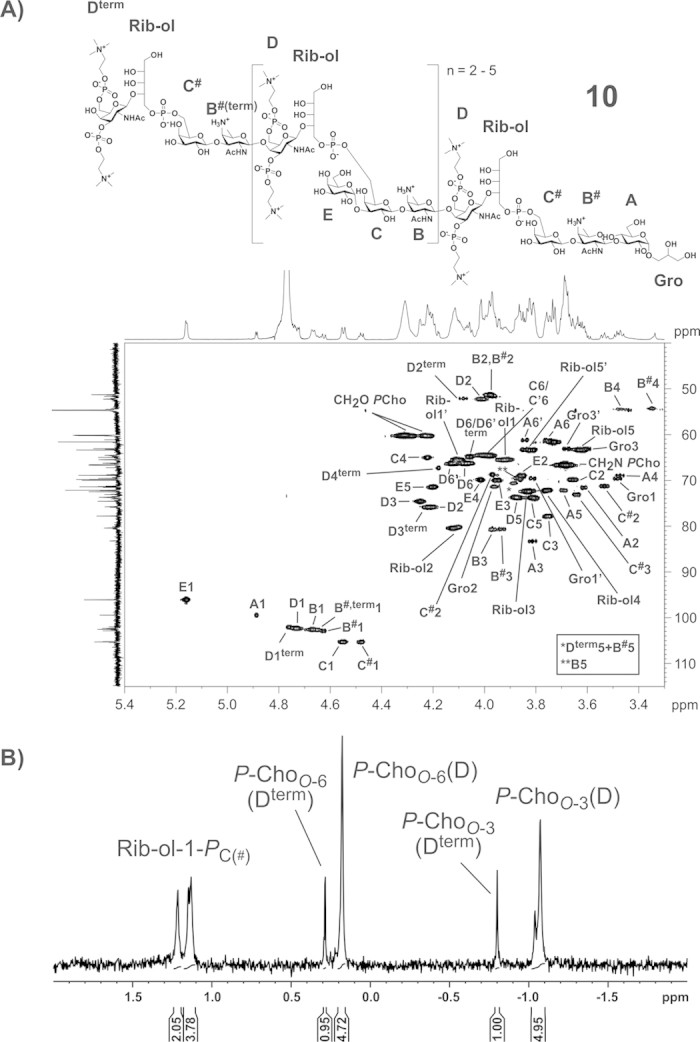
Figure 5. NMR analysis of 10 (mass spectrum shown in Fig. 4).

(A) Section (δH 5.40–3.30; δC 115–40) of the 1H,13C-HSQC NMR spectrum including structure and assignment of signals. (B) Section (δP 2-(−2)) of the 31P NMR including assignment of signals. All NMR chemical shift data of 10 are listed in Table 1.
