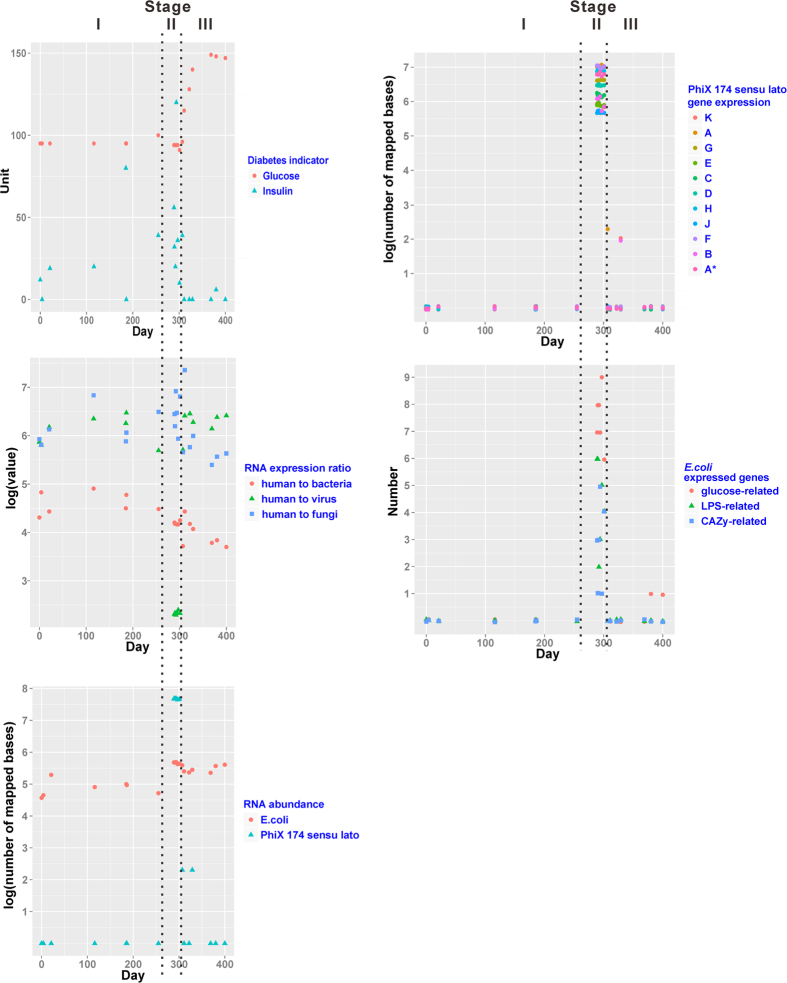
Figure 1. Plots of hyperglycemia indicators, RNA expression ratios of human to microbiome, relative RNA abundance and gene expression level over the 14-month iPOP study.
LPS: lipopolysaccharide, CAZy: Carbohydrate-Active Enzymes. Stage I: after HRV but before RSV infection, Stage II: after RSV infection until the last time point before the onset of high blood glucose. Stage III: after the onset of hyperglycemia.

