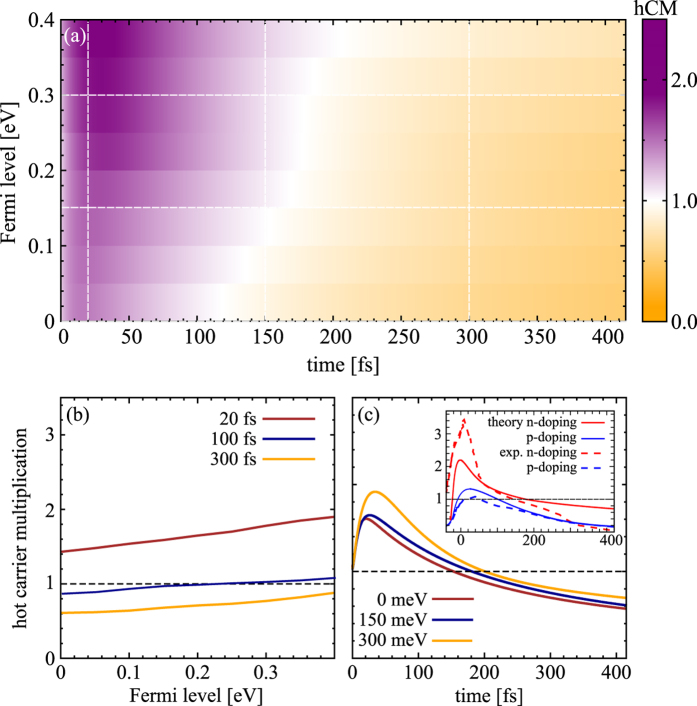
Figure 5. Doping dependence of hot carrier multiplication (hCM).
The same plot as in Fig. 4 illustrating now the temporal evolution of the doping-dependent hCM for a fixed absorbed pump fluence of εabs = 0.3 μJcm−2. The inset in (c) shows a direct comparison between theoretically predicted (solid lines) and experimentally measured time-resolved ARPES data (dashed lines) for: (i) n-doped graphene (EF = 380 meV, εabs = 0.5 μJcm−2) and (ii) p-doped graphene (EF = 240 meV, εabs = 1.5 μJcm−2). The experimental data is taken from Johannsen et al.16.

