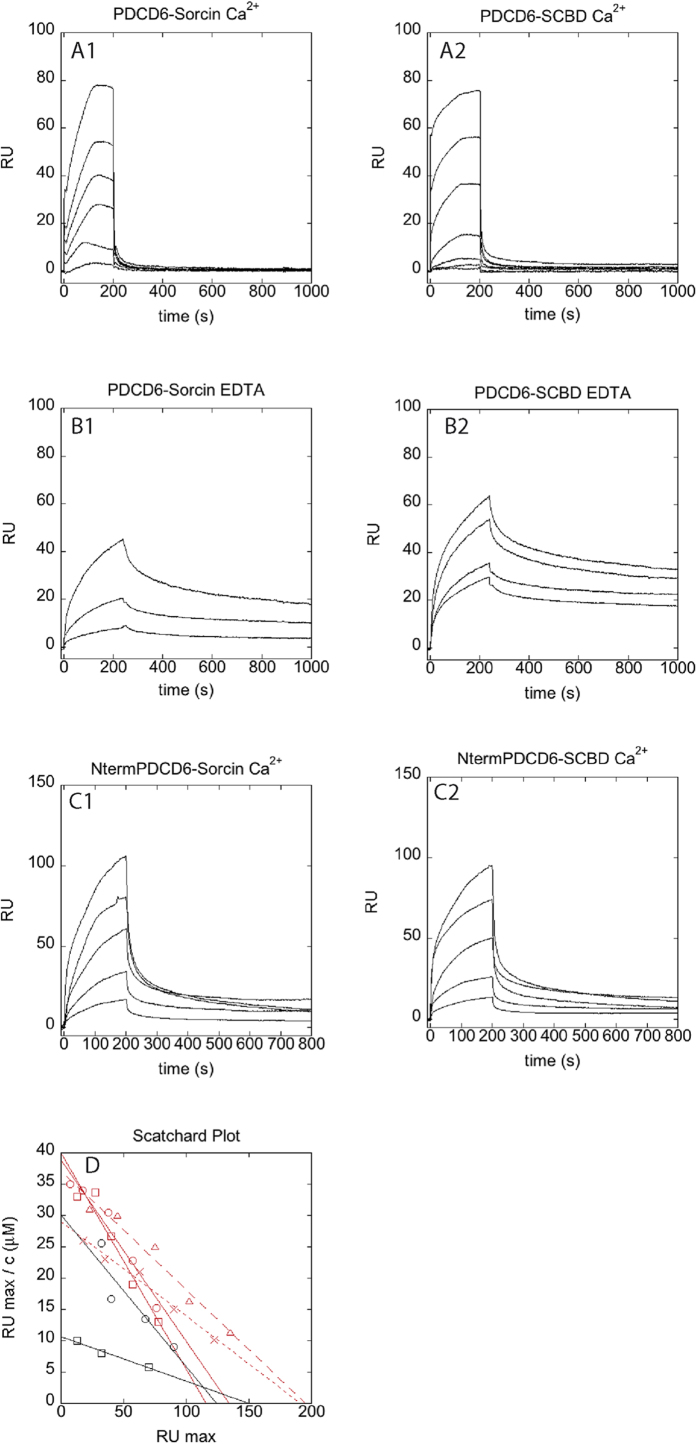
Figure 8. Interaction of Sorcin with full-length PDCD6 and N-terminus of PDCD6.
(A) Sensorgrams showing the interaction between PDCD6, immobilized on a COOH5 chip and different concentrations of Sorcin (left panel; from bottom to top: 200 nM, 400 nM, 800 nM, 1.5 μM, 3 μM, 6 μM), and SCBD (right panel; from bottom to top: 50 nM, 100 nM, 200 nM, 500 nM, 1 μM, 2.5 μM, 5 μM), in the presence of 100 μM calcium. (B) Sensorgrams showing the interaction between PDCD6, immobilized on a COOH5 chip and different concentrations of Sorcin (left panel: from bottom to top: 1.3 μM, 4 μM, 12 μM), and SCBD (right panel: from bottom to top: 1.25 μM, 2.5 μM, 5 μM, 10 μM), in the presence of 1 mM EDTA. (C) Sensorgrams showing the interaction between the N-terminal domain of PDCD6, immobilized on a COOH5 chip and different concentrations of Sorcin (left panel; from bottom to top: 750 nM, 1.5 μM, 3 μM, 6 μM, 12 μM), and SCBD (right panel; from bottom to top: 750 nM, 1.5 μ μM, 3 μM, 6 μM, 12 μM), in the presence of 100 μM calcium. (D) Scatchard plots of the experiments in Fig. 8A–C, and linear fittings. Red squares: PDCD6-Sorcin interaction in the presence of 100 μM calcium; red circles: PDCD6-SCBD interaction in the presence of 100 μM calcium black squares: PDCD6-Sorcin interaction in the presence of 1 mM EDTA; black circles: PDCD6-SCBD interaction in the presence of 1 mM EDTA; red triangles: N-terminal domain of PDCD6-Sorcin interaction in the presence of 100 μM calcium; red crosses: N-terminal domain of PDCD6-SCBD interaction in the presence of 100 μM calcium.

