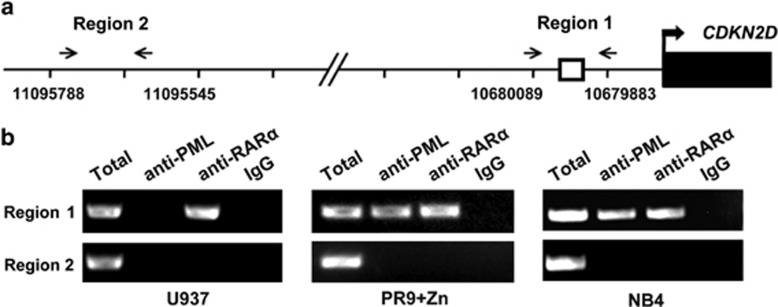
Figure 3.
PML/RARα binds to the endogenous CDKN2D promoter. (a) Schematic representation of the CDKN2D promoter region. The bent arrow represents the transcriptional start site. □ represents the ER8 site. The paired arrowheads represent the primers used in the ChIP analysis. (b) The ChIP assays of PML/RARα binding within the CDKN2D promoter were performed in U937 cells, ZnSO4-treated PR9 cells and NB4 cells. The total input and immunoprecipitated DNAs were analyzed by PCR using primers specific (region 1) or non-specific (region 2) to the ER8 site. Left: the positive band was amplified in the region 1 using the anti-RARα immunoprecipitation in U937 cells. Middle: region 1 was highly enriched by both the anti-PML and anti-RARα antibodies in ZnSO4-treated PR9 cells. PR9 cells were treated with 100 μM ZnSO4 for 4 h. Right: region 1 was highly enriched by both the anti-PML and anti-RARα antibodies in NB4 cells. Total input and DNAs immunoprecipitated by normal IgG served as positive and negative controls, respectively

