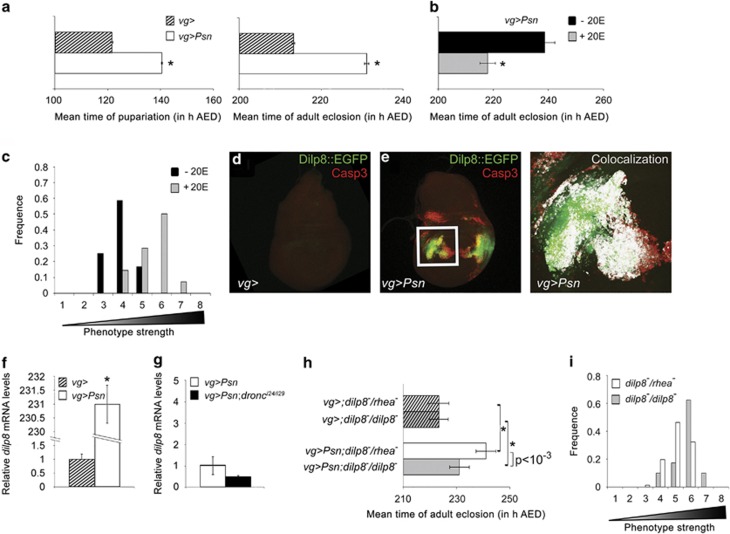
Figure 2.
Dilp8-induced developmental delay favors tissue homeostasis after ER stress. (a) Effects of Psn overexpression on pupariation and adult eclosion timing. Hatched bar (vg-GAL4/+) and open bar (vg-GAL4, UAS-Psn, UAS-Psn/+) represent mean time in hours AED of pupariation (left) or adult eclosion (right). Error bars represent the S.E. of the mean. Asterisks indicate a significant difference with the control (Left: n=4, P<10−5, ANOVA), (Right: n=6, P<10−7, ANOVA). (b) Effects of 20E food supplementation of 92 h AED old vg-GAL4, UAS-Psn, UAS-Psn/+ larvae on adult eclosion. Error bars represent the S.E.M. of three independent experiments (asterisk: P<5%, ANOVA). (c) Distribution of notched-wing phenotypes after 20E supplementation (gray bars) or not (black bars) according to their strength in a representative experiment (n=3, P<5%, ANOVA). (d, e) Third-instar wing imaginal discs carrying Dilp8::EGFP (green) and immunostained with an antiactivated caspase 3 antibody (red). Genotypes are vg-GAL4/+ dilp8MI00727/+ (d) and vg-GAL4, UAS-Psn, UAS-Psn/+ dilp8MI00727/+ (e). The enlargement of the boxed area in e, shows signal colocalization highlighted in white thanks to the ImageJ Colocalization plugin. (f, g) dilp8 RNA levels measured by quantitative reverse PCR. Data represent mean ± S.E.M. of three independent experiments. RNA was extracted from control (vg-GAL4/+, hatched bar, (f) or ER stressed (vg-GAL4, UAS-Psn, UAS-Psn/+, open bar, f and g) or ER-stressed dronc mutant (vg-GAL4, UAS-Psn, UAS-Psn/+ droncI24/ droncI29, black bar, g) wing imaginal discs. The asterisk indicates a significant difference with the control (P<10−4, Student's t-test). (h). Effects of dilp8 homozygous mutation (dilp8MI00727/dilp8MI00727, gray bars) compared with dilp8 heterozygosity (dilp8MI00727/rheaMI00296, white bars) on adult eclosion of vg-GAL4, UAS-Psn, UAS-Psn/+ (plain bars) and vg-GAL4/+ (hatched bars) on mean time of adult eclosion. The rheaMI00296 strain is commonly used as the control for dilp8MI00727 genetic background.23 Asterisks indicate significant difference from the corresponding control that does not express Psn (P<10−4, ANOVA). Error bars represent the S.E.M. of six independent experiments. (i) Distribution of notched-wing phenotypes of vg-GAL4, UAS-Psn, UAS-Psn/+ dilp8MI00727/dilp8MI00727flies (gray bars) compared with vg-GAL4, UAS-Psn, UAS-Psn/+ dilp8MI00727/rheaMI00296 flies (open bars) (n=3, P<10−6, ANOVA)

