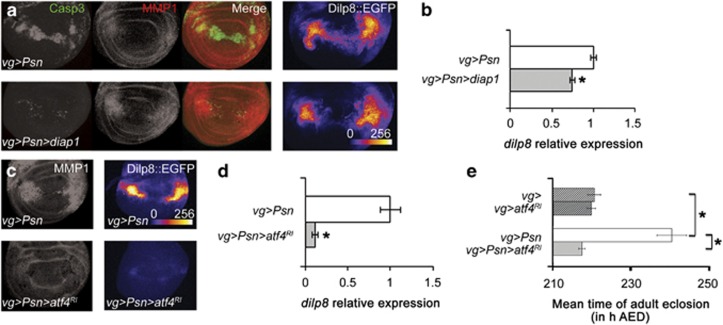
Figure 5.
ATF4 activates the JNK pathway. (a, left) Anti-activated caspase 3 (green) and anti-MMP1 (red) staining in vg-GAL4, UAS-Psn, UAS-Psn/+ (top) and vg-GAL4, UAS-Psn, UAS-Psn/+ UAS-diap1/+ (bottom) third-instar wing imaginal discs. (a, right) Intensity of GFP in vg-GAL4, UAS-Psn, UAS-Psn/+ dilp8MI00727/+ (top) and vg-GAL4, UAS-Psn, UAS-Psn/+ dilp8MI00727/UAS-diap1 (bottom) third-instar wing imaginal discs. (b) Quantification of relative dilp8::EGFP expression. Error bars represent the S.E.M. of at least nine independent experiments. The asterisk indicates significant difference between the indicated genotype and the control (P<10−5, ANOVA). (c) Anti-MMP1 staining (left) and intensity of Dilp8::EGFP detection (right) in vg-GAL4, UAS-Psn, UAS-Psn/+ (top) and vg-GAL4, UAS-Psn, UAS-Psn/+ UAS-atf4-RNAi (bottom) third-instar wing imaginal discs. (d) Quantification of relative dilp8 expression. Error bars represent the S.E.M. of at least four independent experiments. The asterisk indicates significant difference between the indicated genotype and the control (P<10−4, ANOVA). (e) Effects of ATF4 depletion (gray bars) compared with control (white bars) on vg-GAL4, UAS-Psn, UAS-Psn/+ (solid bars) and vg-GAL4/+ (streaked bars) on the mean time of adult eclosion. Error bars represent the S.E.M. (n=3). The asterisk corresponds to a statistical difference (P<10−3, ANOVA)

