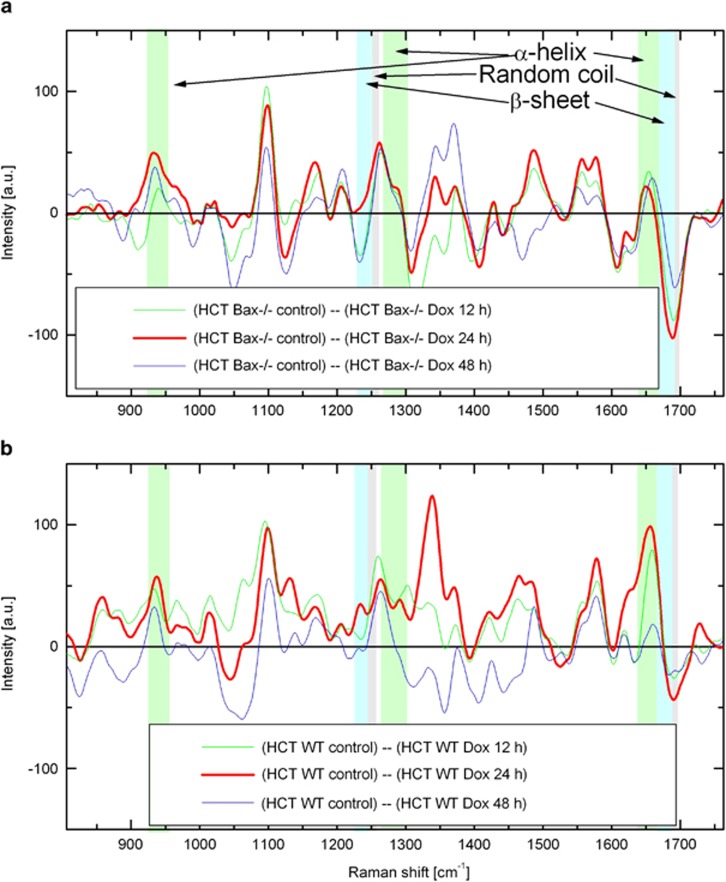
Figure 4.
Dynamics of protein conformation changes during Dox treatment. (a and b) Difference of normalized Raman spectra of protein in mitochondria averaged over HCT116 Bax−/− (a) and HCT116 WT (b), and randomly chosen cells as described in Materials and Methods section. Green, red, and blue lines represent differences in mitochondria proteins between untreated and treated at 12, 24, and 48 h, respectively, in HCT116 Bax−/− (a) and HCT116 WT (b). Dox, doxorubicin; HCT, HCT116

