Figure 6.
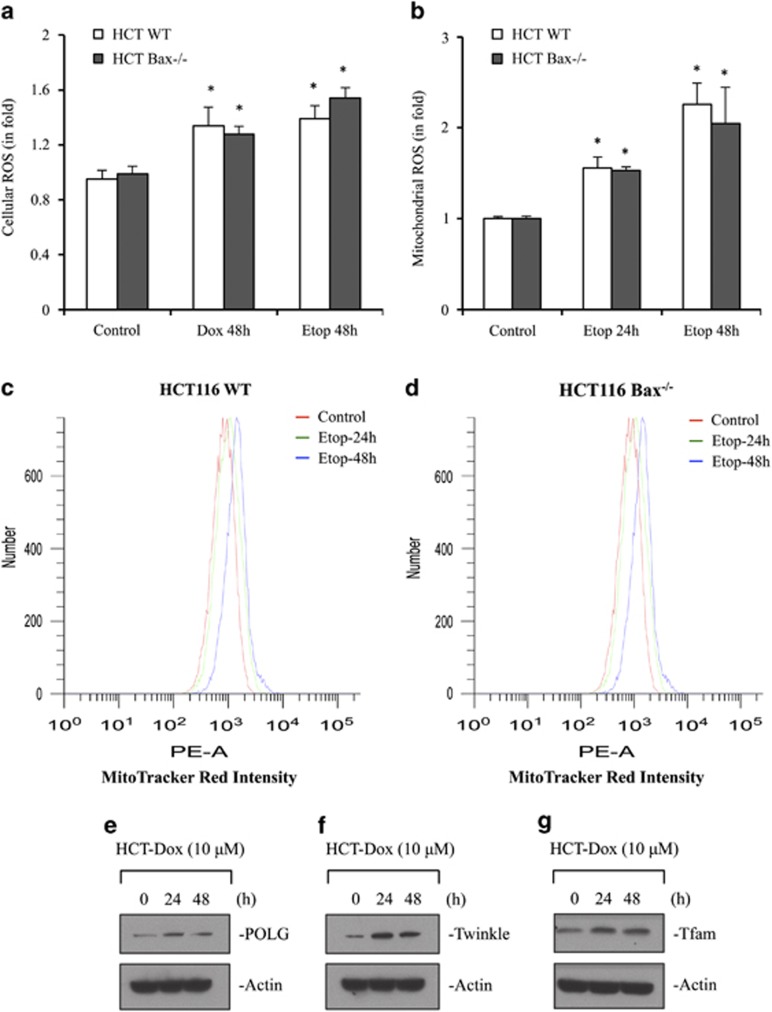
DNA-damaging agents induce cellular ROS, mitochondrial ROS, and expression of proteins required for mtDNA replication and its transcription. (a) HCT116 WT and HCT116 Bax−/− cells were treated with DMSO or Dox (10 μM) or etoposide (10 μM) for 48 h. Cellular ROS were determined using flow cytometer after incubation with dihydrorhodamine 123 (DHR123). (b–d) HCT116 WT and HCT116 Bax−/− cells were treated with DMSO or etoposide (10 μM) for indicated times. Mitochondrial ROS were measured using flow cytometer after incubation with mitochondria-specific dye, MitoTracker Red (CM-H2XRos). (e–g) HCT116 WT cells were treated with Dox (10 μM) for the indicated time intervals. After treatment, cells were harvested and equal amount of proteins were analyzed by western blot for quantification of protein level of POLG (e), Twinkle (f), Tfam, mitochondrial transcription factor A (g). Actin was used as a normalization control. Data (a and b) are mean±S.D., n=3; *P<0.05 as compared with DMSO-treated cells. Representative graphs of mitochondrial ROS are shown in c and d. HCT, HCT116; Etop, etoposide; Dox, doxorubicin; number, number of cells or number of events

