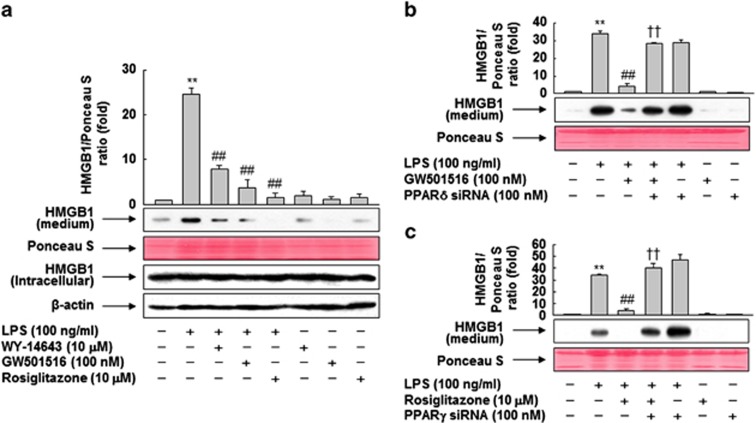
Figure 1.
Ligand-activated PPARs inhibit LPS-induced release of HMGB1. (a) RAW 264.7 cells grown to 60% confluency were incubated in serum-free medium for 24 h, and then stimulated with LPS in the presence or absence of PPAR ligands for 24 h. (b and c) Cells were transfected with siRNA against PPAR-δ (b) or PPAR-γ (c), and grown for 38 h. After incubation in serum-free medium for 24 h, the cells were stimulated with LPS for 24 h in the presence or absence of GW501516 (b) or rosiglitazone (c). Equal volumes of conditioned media or aliquots of cell lysates were subjected to western blotting for determination of HMGB1 levels. An image analyzer was used to quantitate band intensity, and the ratios of HMGB1 to Ponceau S are shown. The results are expressed as means±S.E.M. (n=3). **P<0.01 compared with the untreated group; ##P<0.01 compared with the LPS-treated group; ††P<0.01 compared with the group treated with LPS+GW501516 or rosiglitazone. Ponceau S staining or β-actin was used as a loading control

